Story retelling and verbal working memory in people with aphasia
Article information
Abstract
Purpose
This study explored the relationship between story retelling and verbal working memory (VWM) in people with aphasia due to left-hemisphere damage (PWA), people without aphasia with left-hemisphere damage (LHD) and normal healthy controls (HC).
Methods
Fifteen age-matched HC and fifteen of each, PWA and LHD participants were enrolled and their performances on the Story Retell Procedure (SRP) and WM tasks were compared with tests of association and tests of difference. The experimental tasks included the SRP, where each participant retold three stories, and “percent information units per minute (%IU/Min)” was calculated as an SRP-performance measure. The Alphabet span task served as a WM measure based on a principle component analysis.
Results
All Bonferroni-corrected pairwise comparisons were significant, with the PWA group producing the lowest %IU/Min, followed by the LHD group and then the HC group. The Bonferroni-corrected VWM score differences were also significant across the three groups, with the PWA group producing significantly lower %IU/Min than both other groups. The difference between the LHD and HC groups was not significant. The correlations between the %IU/Min and VWM score were all significant and ranged from 0.50 to 0.75 among the three groups.
Conclusions
SRP performance yielded a continuum across the three groups, suggesting that SRP performance in PWA is consistent with a combination of both aphasia-related and brain damage-related deficits.
INTRODUCTION
Story retelling (SR) in people with aphasia (PWA) has been investigated from multiple perspectives. McNeil et al. [1,2] found that the %IU/Min metric is more sensitive than %IU in differentiating PWA from healthy controls (HC). SR has also been investigated from a resource-allocation perspective, employing visual-manual tracking under dual-task conditions [3–5], relative to primacy/recency serial position effects [6] and short-term memory demands [7–10] in normal aging and child language disorders. Montgomery, Polunenko, and Marinellie [9] found that resource capacity is importantly implicated in children’s ability to understand spoken narrative. Gabig [8] claimed that SR requires significant VWM demands and also relates to processing linguistic information, cognitive organization, and regulatory control. Gabig [8] speculated that difficulty in SR might be due to either primary or secondary linguistic representation deficits required for simultaneous processing and recall rather than impairment in VWM capacity per se.
Significant and reliable differences have been found between PWA and age-matched HC on the SR tasks. Lower SR performance in PWA compared to that of HC might not indicate that the presence of aphasia is responsible for the difference. It is unclear whether these differences are attributable to the presence of aphasia or more generally to the presence of left-hemisphere damage (LHD). It is therefore important to compare SR performance between people with and without aphasia after LH stroke as well as with performance of HC.
In addition to examining differences between groups, the relationship between SR and VWM has been inadequately investigated in PWA. While Brodsky et al. [6] examined the primacy/recency serial position effects in SR in PWA, which involve components of VWM; specific components of VWM, such as maintaining, manipulation, and updating have not been investigated. Gabig [8] used three measures of VWM (nonword repetition, digit span, and sentence imitation) in the SR study of children with autism. These VWM tasks engage short-term memory (STM), including rehearsal, but do not engage the executive components of VWM such as updating and manipulation [11,12]. Updating is a crucial function in SR in order to remember passage details within the story. The manipulation part of VWM is also necessary for SR in order to integrate information and make appropriate inferences about the story’s meaning.
The aims of this study were to explore whether the SR and VWM performances are aphasia-specific or more generally due to LHD, and to examine the relationship between the SR and VWM performances within the three groups. In order to address these issues, significant differences between the two groups of volunteers with left hemisphere damage secondary to stroke with and without aphasia, and the HC group were compared on the SRP and a measure of VWM. Correlations were computed between measures on the SRP and VWM for each group. It was hypothesized that strong correlations would exist between SR and VWM performances and that these correlations would be strongest in the PWA group, followed by the LHD group, and finally the HC group.
METHODS
Participants
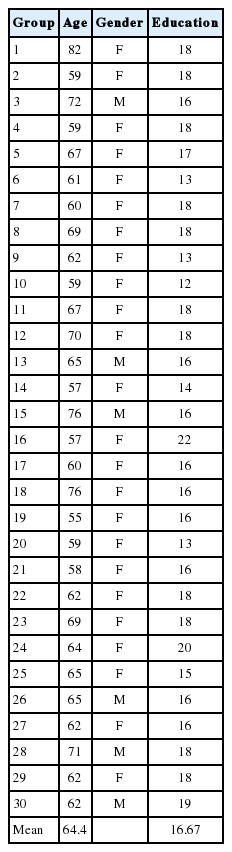
Sixty participants were enrolled in this study: 1) 15 individuals with LHD after a stroke that resulted in aphasia (PWA group), 2) 15 individuals with LHD after a stroke that are without aphasia (LHD group), and 3) 30 HC without brain damage (HC group). Age and years of education were not significantly different among the three groups. Age and education information for the three groups are presented in Table 1. The study was approved by the Institutional Review Board (IRB) of the University of Pittsburgh (IRB# PRO15120107). Informed consent was obtained from all patients before inclusion in the study. Participant recruitment and enrollment were based on the following resources: 1) the University of Pittsburgh Research Participant Registry (https://www.researchregistry.pitt.edu/Researchers.shtml), 2) the Western Pennsylvania Patient Registry (http://www.wppr.pitt.edu/wppr_research.html) and 3) the Bethel Park community center.

Descriptive Information of Participants
All participants met the following screening criteria: (a) native American English speaker and (b) at least 8 years of education, determined by a self-reported questionnaire. Participants were also assessed for (c) 20/40 or better binocular acuity by the reduced Snellen chart. (d) greater than 0.70 ratio (the delayed recall/immediate language recall×100) from the Assessment Battery of Communication in Dementia (ABCD) [13]. The HC participants self-reported a negative history for neurologic, limb motor, psychiatric, visual, speech/language, or reading impairments.
The demographic and descriptive evidence for all participants in the PWA and LHD groups included evidence of a unilateral LH lesion from medical history and/or brain imaging. Appendices 1–3 provide descriptive information for all participants in this study.

Demographic and Lesion Information for PWA individuals

Demographic and Lesion Information for LHD individuals
Demographic Information for NHC individuals
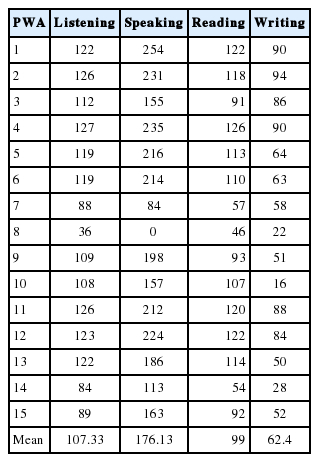
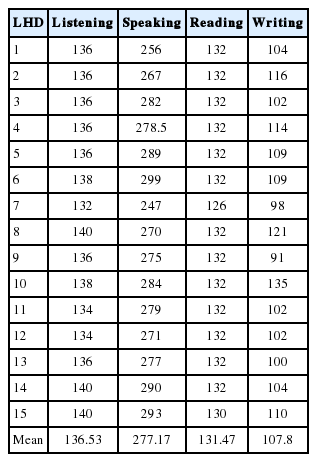
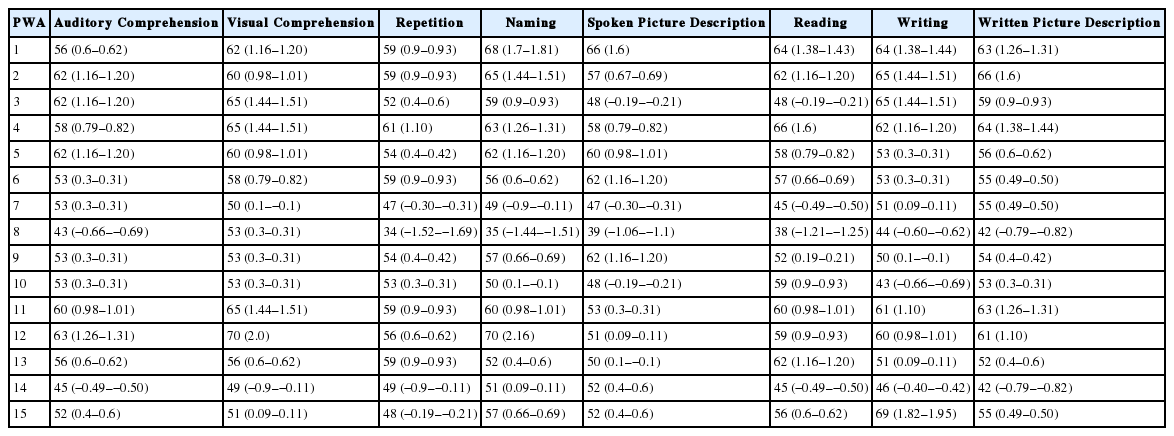
The PWA and LHD groups were examined for aphasia using the Comprehensive Aphasia Test (CAT) [14]. All individuals with aphasia met the definition of aphasia [15] and the following inclusion criteria: deficit 1) on at least one subtest (determined by pre-established cutoff scores for each subtest in the CAT) or 2) on the summary score from at least two different language modalities (listening, speaking, reading, and writing) on the test. Appendices 4–7 provide the CAT scores and the t and z scores for the CAT subtests for the PWA and LHD groups.
CAT Scores for PWA Individuals
CAT Scores for LHD Individuals
T and Z scores for PWA individuals: T (Z-scores)

T and Z scores of LHD: T (Z-scores)
Materials & Procedures
Experimental Tasks
Each participant performed three SRP stories (Loan, Gas, and Library) [16], and the %IU/Min was calculated based on the average of the three stories. The Digit-span forward [17], Sentence span [18], Subtract-2 span tasks [19], and Alphabet span task [19] were included initially for WM measures, and the Alphabet span task was eventually selected as the WM task based on the results of a principle component analysis (PCA).
Story Retelling
Each participant listened to each of the three stories from one form of the SRP battery, and retold the story, in their own words, to the examiner. The retelling from each participant was recorded and scored for %IU/Min using the standardized score sheet, by a native English-speaking graduate student majoring in speech and language pathology.
Working Memory (WM)
The Digit-span forward [17] and Sentence span [18], Sub- tract-2 span [19], and Alphabet span tasks [19] were included as short-term or working memory tasks. The forward-digit span task was presented using E-Prime 1.0 [20]. For this task, participants listened to a series of digits and pointed to those digits in order, selected from nine digits displayed on the computer screen. The sentence span task was also presented using E-Prime 1.0. For this task, participants read each sentence at each span and were requested to remember the last word of the sentence. Participants also responded to a question about the sentences’ meaning. The number of words recalled indexed the sentence span. The subtract-2 span task was presented by the examiner. Participants listened to a series of digits and repeated them to the examiner after subtracting number 2 from each of the digits they heard. For example, if they heard 4-2, they answered with 2-0 after subtracting 2 from each number. The alphabet span task was presented using a recording of the examiner’s voice. In this task, participants listened to a series of words and were required to reorder them in alphabetical order. For example, if they heard “hat-cat,” a correct response would be “cat-hat”. The number of the words presented increased across spans.
Data Analysis
Based on the principle component analysis (PCA), the Alphabet span task was selected as the VWM task. IBM SPSS Statistics 24 was employed for all statistical analyses. An analysis of variance (ANOVA) was computed comparing SRP (% IU/Min) and VWM measure between and within the three groups. Bonferroni post-hoc comparisons were used to correct p-values that were adopted for this study (p=.016). Pearson correlations were computed to examine the association between SRP and VWM.
RESULTS
PCA Results
A PCA with varimax rotation was performed for the WM tasks in order to identify those with the greatest shared variance and interrelationships among tasks. The task with the highest value was selected, and it was found that the Alphabet span task’s eigenvalues explained 76% of variance. Therefore, the Alphabet span task was selected as the most representative WM task. Table 2 summarizes the coefficients derived from the PCA rotated component matrix.
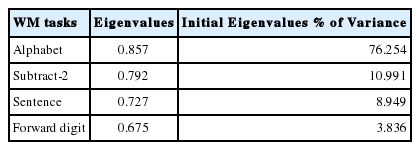
Coefficients derived from the PCA rotated component matrix
ANOVA Results
The results of the ANOVA for SRP performance (%IU/Min) revealed a significant difference across the three groups (see Table 3) (F(2, 57)=62.01, p=0.000). Bonferroni post-hoc comparisons indicated that the PWA group produced significantly fewer %IU/Min (M=9.8, SD=1.87) than the HC group (M= 34.5, SD=1.32) and significantly fewer than the LHD group (M=27.3, SD=1.87). The LHD group’s %IU/Min (M=27.3, SD=1.87) was also significantly lower than the HC group’s %IU/Min (M=27.3, SD=1.87).
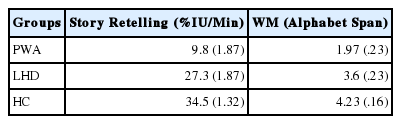
Results of Story Retelling and VWM measure
The results of the VWM measure also revealed significant differences among the three groups (F(2,57)=34.01, p=0.000). The VWM scores in the PWA group (M=1.97, SD=0.23) were significantly lower (p=0.000) than those in the HC group (M= 4.23, SD=0.16, and significantly lower (p=0.000) than those in the LHD group (M=3.6, SD=0.23. However, the VWM scores in the LHD group did not differ significantly (p=0.075) from those of the HC group.
Pearson Correlation Results
Correlations between the SRP and VWM scores are summarized in Table 4. The correlations were significant and moderate to high across the three groups. The highest correlation was evidenced in the PWA group (r=0.748 p=0.001), followed by that in the LHD group (r=0.620, p=0.014) and then in the HC group (r=0.503, p=0.005).
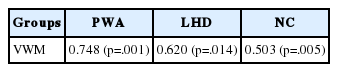
Correlation Coefficient r from Pearson Correlation Analysis between Story Retelling Procedure and VWM measure scores
DISCUSSION
The first goal of this study was to examine whether the PWA group exhibited aphasia-specific deficits in SR and VWM that taxes updating and computation functions compared to the LHD and HC groups. The second goal examined the association between SR and VWM within each group.
The PWA group’s SR performance was significantly lower than the other two groups with the LHD group performing intermediary between the aphasic and healthy control groups. Because the LHD non-aphasic group differed significantly from the healthy controls and the PWA group, who shared a left hemisphere lesion with the LHD group, it is proposed that the SR deficits in PWA result from combined aphasia-related and brain damage-related deficits rather than aphasia-specific deficits. More specifically, the difference in performance between the PWA and LHD groups suggests an additive effect of aphasia beyond the lesion on SRP performance. Correspondingly, the significantly lower performance by the LHD group compared to the HC group is consistent with a stroke-induced brain damage-related deficit. Therefore, SR deficits in PWA are consistent with a combined aphasia-related and brain damage-related effect.
There were also group differences in VWM performance. The PWA group had significantly lower scores than both the LHD and HC groups. However, the performance of the LHD group was not significantly different from the HC group. Unlike performance on the SRP task, VWM performance in PWA appear to be aphasia-specific rather than due to combined stroke-induced aphasia and brain damage effects.
The relationship between the SR and VWM performances across the groups revealed the strongest correlation in the PWA group, followed by the LHD group followed by the weakest, but still significant, correlation between SR and VWM in the HC group. Consistent with the Brodsky et al. study [6], and adding to memorial requirements of the SRP task, this pattern indicates that VWM, as measured by these working memory tasks, is reliably related to SR performance. This becomes more evident as both SR and VWM performance is less efficient or more impaired. More specifically, these results suggest that the underlying cognitive operations required for these VWM tasks are related to and predictive of SR performance in PWA. This might be because SR requires the updating and/or computing components of VWM, which are unique and attributable to the presence of aphasia.
The pattern of SR performance across the groups suggests that SRP deficits are not specific to PWA. The significant difference in SRP performance between the LHD and HC participants does support the sensitivity of the task for indexing the presence of brain damage with or without the presence of aphasia. The establishment of cutoff scores on this specific task is required in order to use it as a diagnostic criterion for the presence or absence of aphasia. SRP performance does, however, provide a useful measure of overall language performance and can serve as a measure useful for targeting treatment and for establishing both severity of deficits and as a tool for indexing recovery from brain damage and aphasia.
Gabig [8] concluded that story retelling makes considerable demands on VWM as well as on other cognitive processes such as cognitive organization and regulatory control. VWM measures may supplement measures of language performance in the diagnosis and evaluation of brain damage and aphasia. The results of the current study suggest that the presence of language deficits following stroke is not unique to PWA. The degree to which VWM is required to build linguistic representations in PWA and is the source of their connected language performance deficits, as measured by tasks such as the Story Retell Procedure, remains an important area for future research.
CONCLUSIONS
The current study examined associations and differences in story retelling and verbal working memory performance in PWA, LHD, and HC groups. It was found that only story retelling, as measured by percent information units per minute differed significantly among the three groups. Verbal working memory performance was significantly poorer for the PWA group than the other two groups, who did not differ from each other. The correlations between the story retelling and verbal working memory ranged from moderate to strong within the three groups.
The present findings are interpreted as evidence that story retelling performance in PWA is impaired by both aphasia-related and brain damage-related deficits and that SR deficits in PWA might be caused by both deficits in processing linguistic-specific rules and representations and by additional limitations in cognitive processes involved in verbal working memory such as maintenance, manipulation, and especially updating processes.