Phonemic Awareness Assessment of Children With and Without Speech Sound Disorders: A Comparison Study
Article information
Abstract
Purpose
When assessing phonemic awareness (PA) ability, tasks that require verbal (oral) responses are often used. If verbal (oral) answers contain speech sound errors, it may be difficult for the evaluator to determine accuracy of PA skill. The present study aimed to investigate the relationship between speech sound production and PA in first and second grade children with and without speech sound disorders (SSD) using a nonverbal (non-oral) response format.
Methods
Thirty children with SSD (M age=7;3; SD=0.6) and 30 children with typical development (TD) (M age=7;3; SD=0.6) were given measures of speech sound production and phonemic awareness. Two measures of PA were administered: (1) a static assessment of phoneme deletion that required a verbal (oral) response and (2) a dynamic assessment of phoneme deletion that did not require a verbal (oral) response. Results from the two PA tasks and a speech sound production measure were compared.
Results
Results showed that performance on measures of speech sound production and PA were significantly correlated (r=0.59) and a strong correlation between a verbal (oral) measure of phoneme deletion and a nonverbal (non-oral) measure of phoneme deletion using a dynamic format (r=−0.75). Children with SSD scored more poorly than did the TD children on PA skills (p<0.01).
Conclusions
This study strengthens the findings of other researchers who found significant correlations between speech sound production and PA and that children with SSD have more difficulties with PA skills than TD children.
INTRODUCTION
High stakes testing and performance-based funding models increase the pressure to accurately identify reading problems in children as early as possible. Assessments used to measure reading-related skills, such as phonemic awareness (PA) have conventionally require verbal (oral) responses. Consequently, measures that require verbal (oral) responses may not accurately measure skills (e.g., oral reading fluency or word finding) in children who exhibit communication issues, specifically, children who do not speak clearly and fluently [1,2], such as children with speech sound disorders (SSD).
Children with SSD have been described in the literature as a population at risk for not developing the necessary PA skills for reading, and accordingly, acquiring competent literacy skills [3,4]. An SSD has been defined as a “significant delay in the acquisition of articulate speech sounds” [5, p. 1294]. Fifty to 75% of children found to have SSD in preschool were found to have academic problems when they were reached school-age [6,7]. Raitano et al. [8] found that children with SSD aged five to six years performed more poorly than did those with typically developing phonological systems. Carroll et al. [9] suggested that some children have difficulties in learning to read as a result of underlying problems in the use of stored phonological information. They proposed that children with SSD have problems with the sounds of the language at the level of the underlying phonological representation that will affect the ability to adequately access the sound symbol association required for decoding novel words.
However, children with SSD are a varied population [10] and do not all exhibit problems in learning to read [11]. In a study completed by Snowling et al. [12], the authors found no differences in reading and spelling skills when comparing children who had speech problems in preschool reassessed at age 15 when compared to age-matched peers. Consequently, examining the relationship between SSD and PA in young children has the potential to clarify the ability to process phonological information as it relates to speech and later reading development.
Therefore, the purpose of this study was to investigate the relationship between SSD and PA in children in the first and second grade. Further, the performance of two groups of children, those with SSD and typically developing (TD) children without SSD were compared on two measures of PA (i.e., phoneme deletion); one given in a static format that required a verbal (oral) response and one given in a dynamic assessment format that did not require a verbal (oral response). The static test was a typical phoneme deletion task used to assess PA where the child was asked to say a word that was left over after a sound was deleted (see Appendix A), and a dynamic test that included a graduated prompting system and pictures and the child was asked to point to a picture of the word that was left over after a sound was deleted (see Appendices B and C). The dynamic test was used to assess the child’s ability to exhibit learning and transfer from the graduated prompting system as well as respond without using speech.
Phonological awareness and phonemic awareness
Since the 1980s, there has been a considerable amount of research in the area of phonological awareness and PA and its relationship to early reading acquisition [13–16]. The terms phonological awareness and PA are often used to represent the same construct; however, children demonstrate this skill in different ways. While both phonological awareness and PA refer to the understanding of larger units of spoken speech (i.e., words, syllables, onsets and rimes), PA refers to the more specific ability to understand and manipulate the smaller units of spoken speech (i.e., phonemes) [17]. Both phonological awareness and PA are necessary in developing reading, development of PA of its relationship to later reading skill has received more attention [13].
Ehri et al. [18] suggests that when children understand PA, they are able to manipulate phonemes by isolating, blending, segmenting, and deleting one for another. Adequate PA skill has been shown to be consistently and highly predictive of success in reading and spelling [19]. Consequently, the success that a child has in learning to read is supported by the level of PA he/she has when entering school [13]. Thus, TD children will be able to complete PA (i.e., phoneme deletion) by 8 years of age [20]. If children have problems with developing expressive phonology, they may not develop necessary PA skills because of the difficulty accessing the sound-symbol association required for word reading [9].
Phonemic awareness assessment
Most children are typically assessed on PA during their first few years of formal schooling (i.e., kindergarten, first, and second grades) using informal assessments or standardized, norm-referenced assessments that require verbal (oral) responses. For example, in his seminal work, Bruce [20] assessed PA using and informal assessment in TD 5-, 6, and 7-year olds by asking them to say words that were left over after a sound was deleted. Many children in elementary school are assessed on PA skills using a standardized, norm-referenced assessment such as the Comprehensive Test of Phonological Processing-2 (CTOPP-2) [21]. The CTOPP-2 is designed to measure PA skills by requiring verbal (oral) responses to phoneme blending, deletion, and elision tasks. This may be problematic for assessors when scoring verbal (oral) responses from children who exhibit speech sound errors, such as children with SSD. Guidelines for scoring verbal (oral) responses that contain speech sound errors in the studies and manuals reported here are not provided nor have guidelines in general been included for testing learners who have other expressive speech and language difficulties.
In addition, the aforementioned PA assessments (i.e., Bruce’s (1964) informal PA deletion task and the PA tasks assessed on the CTOPP-2) are considered to be static, one-point in time measures. The test items are presented one at a time and the child responds to each one without feedback or assistance from the examiner [22]. Thus, data from a static assessment reflects a score or set of scores of a child’s previous learning (i.e., knowledge that has been acquired up to this point in time) and the results are used for evaluation, identification, and classification purposes.
In contrast, there are a number of paradigms that have been used to assess PA via a nonverbal (non-oral) recognition type format administered as a static, one-point in time measure. For PA tasks that do not require a response via speech, children are asked to reflect on their own understanding of the composition of a word to represent their foundational ability with regards to PA. For example, Lance et al. [23] assessed implicit PA by asking TD 6-, 7-, and 8-year olds to judge words that had acceptable consonant clusters using in nonsense word-pairs by choosing the first or second word in each pair. In addition, The Preschool and Primary Inventory of Phonological Awareness (PIPA) [24] designed to measure PA skills in persons aged 3–6:11 years old, also requires nonverbal (non-oral) responses to syllable segmentation skills (i.e., another type of PA task).
Other researchers have examined how well children performed on assessments of phoneme deletion that used recognition or non-oral response format. For example, Claessen et al. [25] measured underlying PA ability by asking 7- and 8-year-old TD children to point to a picture that represented a word after a sound was deleted. The authors concluded that their measure, silent deletion of phonemes task (SDP), was acceptable to use for PA assessment with children who exhibit expressive speech/language difficulties because of its recognition response type format. Furthermore, other authors have previously raised concern about the use of oral response test formats for children with word finding and fluency difficulties specifically in the areas of measuring reading fluency and determining reading instruction levels [1,2]. Again, supporting the notion that nonverbal (non-oral) assessment for such skills may provide greater insight to the underlying mental processing system.
Dynamic assessment
In an extension of Claessen and colleagues’ [25] work, Gillam et al. [26] assessed phoneme deletion ability with a similar paradigm that included a dynamic component. A dynamic assessment has been used as an alternative or supplemental approach to static measures. Whereas static assessment offers no scaffolding or social support for learning, dynamic assessment embodies both the process and product of the child’s learning [27]. In a dynamic assessment approach, the child is given scaffolding, social support for learning, and intervention when they fail. Dynamic assessment provides both diagnostic and prescriptive information [28] that can be applied to a wide variety of behaviors as a nonbiased way to measure language skills [22].
Dynamic assessment, therefore, is used to examine the response of the learner during the process or task and shows potential for learning, thus, can provide diagnosis and basis for treatment [29]. One method or dynamic assessment, graduated prompting, allows for cues to be given that assist a learner as they perform a task and are given to support learning and transfer [27]. For instance, if a child has trouble with phoneme deletion tasks, an examiner should engage the child in tasks of phoneme deletion during the dynamic assessment. The prompts that are developed as a hierarchy of predetermined cues are provided to give varying levels of support throughout the task, thus allowing for learning and expected transfer to occur.
Accordingly, Gillam and colleagues [26] developed a phoneme deletion task using a dynamic assessment that did not require responses via speech. Their task incorporated a prompting system that was based on response errors, which provided insight into the types of errors made and how well each participant responded to the prompts. They advocated this assessment as a way to measure PA ability in children whose speech output is distorted, such as those with SSD. For this task, the children were asked to point to pictures rather than respond verbally (orally). The authors compared the performance of 64 TD children (mean age of 8;0) on a nonverbal (non-oral) dynamic assessment of phoneme deletion (NDAPD) task to the same children’s performance on a traditional static phoneme deletion (SPD) task using the same test items presented without pictures that required verbal (oral) responses. Their results indicated high correlations (r=0.84) between the dynamic and static tasks for the TD children, as would be expected. In addition, acceptable levels of internal consistency reliability were demonstrated (α=0.88) between the dynamic and static tasks, suggesting that these tasks measured a similar construct. The authors suggest that the use of pointing versus verbal (oral) responses may be a viable response mode to examine phoneme deletion ability in children whose speech output is unclear, such as children with SSD.
Aims and research questions
This study aimed to investigate the relationship between SSD and PA in children in the first and second grade. Further, the performance of two groups of children, those with SSD and TD children without SSD were compared on two measures of PA (i.e., phoneme deletion); one given in a static format that required a verbal (oral) response and one given in a dynamic assessment format that did not require a verbal (oral response). Children with SSDs have compromised verbal (oral) output, which affects the accuracy of verbal (oral) responses [30]. A nonverbal (non-oral) measure may allow the children with SSDs to complete phoneme deletion tasks by pointing to pictures in an attempt to assess phonological representation more accurately. A dynamic assessment with a graduated prompting system was used to determine whether this type of approach differentiated children with SSDs from their TD peers. A static measure of phoneme deletion was included for which verbal (oral) responses were required. It was through these measures that the explicit PA abilities of children with SSDs were assessed. The specific research questions under investigation are:
Is there a significant correlation between speech sound production and PA performance among learners (i.e., SSD vs. TD)?
Is there a significant difference in the performance of learners with and without SSD on oral response or non-oral response PA tasks?
Does SSD severity impact PA skills?
METHODS
Participants
Participants were recruited from three elementary schools in a small school district in Louisiana. School performance scores for these three schools (approximately 1,400 students in grades kindergarten through five) showed 25–36% below basic performance and 12% of these three schools population received special education services (which includes those receiving speech-language therapy services). Teachers of first and second graders were asked to refer potential participants who met the following inclusion criteria: were in the first or second grade, had normal auditory acuity, had normal or corrected vision as per school nurse and/or parent report; had no identified developmental delays or emotional disorders; and were monolingual English speakers. In addition, none of the participants were receiving additional services such as special reading instruction as per teacher report. Speech-language pathologists (SLPs) who provided services to first and second graders for speech impairment and who also met the above inclusion criteria were asked to refer participants to the study.
Group selection
As participants entered the study, the Primary Test of Nonverbal Intelligence (PTONI) [31] and the Peabody Picture Vocabulary Test-Fourth Edition (PPVT-4) [32] were administered. All participants a scored within normal limits (equal to or greater than a standard score of 85) on both of these measures.
Participants were also administered the sounds-in-words subtest of the Goldman-Fristoe Test of Articulation-2 (GFTA-2) [33] by the first author to assess production of speech sounds in target words and were assigned to one of two groups (i.e., SSD group and TD group), based on the number of errors on the GFTA-2. The GFTA-2 results are reported as linear standard scores of a normal distribution with a mean of 100 and a standard deviation of 15. However, these scores cannot be interpreted in terms of the normal distribution given that articulation ability is not normally distributed. Most children after a certain age are “normal” and make one or zero errors on the GFTA-2, thus, skewing this normal distribution. For example, one participant in this sample, a female aged 8:3, exhibited four errors, which resulted in standard score of 96 and a percentile of 16, indicating at this age, 84% of the standardization sample made no errors and that only 16% of the sample made that many errors or more. According to the GFTA-2 norms, the percentile of girls this age exhibiting no errors is approximately at >48, indicating that 48% make one or more errors and 52% make no errors. In addition, dialectal sensitive scoring was taken into account in this population of participants on the GFTA-2 responses.
Additionally, percent consonants correct (PCC) adapted from Shriberg et al. [34] was calculated using the single-word responses obtained from the administration of the GFTA-2. For this study, the adapted PCC was calculated by dividing the number of correct consonants the child produced by the total number of proposed consonants (77) and multiplying by 100. Although PCC is typically calculated using running speech, this calculation was used in this study as an indicator of severity. In order to include participants in the SSD group who continue to exhibit speech sound errors that are not typical for their age, participants who exhibited more than two errors (below 96% PCC) were placed in the SSD group and those with two or fewer errors (above 96%) were placed in the TD group. The final sample was comprised of 60 participants; 30 in the SSD group (M=82.6; SD=10.9) and 30 in the TD group (M=108.1; SD=6.1). Table 1 contains the demographics of participants per group. Table 2 contains the means and standard deviations for ages and scores by inclusion criteria.
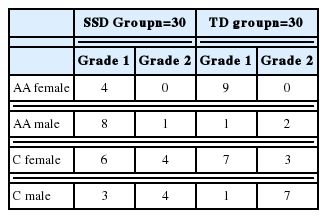
Demographics of participants per group

Means, Standard deviations, and Minimum and Maximum Scores by Inclusion Criteria Group
Approval to conduct this study was granted by the Institutional Review Board University of Central Arkansas Sponsored Programs Office; informed parental consent and participant assent were obtained for all participants.
General procedures
Testing was conducted in a small, quiet room on the school premises for 59 of the participants over two, one-hour sessions on separate days to minimize the amount of time that the participant was out of the classroom. One participant was assessed at a university speech and hearing clinic with a short break between the two sessions. Testing of all participants occurred within a six-week period of time.
Descriptive measures
Nine trained speech-language pathology graduate students administered the pure-tone audiometric screening, the PPVT-4, and the PTONI in alternating order as the participants entered the study under the supervision of the first author. All researchers completed a two-hour training session on the administration and scoring of the assessments conducted by the first author. In addition, all researchers practiced administration and scoring of the measures on each other under the supervision of the first author and feedback and clarification was provided.
PA tasks
The first author administered two measures of phoneme deletion, NDAPD, and SPD, both developed by Gillam et al. [26] to the participants. Both tasks required processing of stimuli presented verbally (orally), however, the NDAPD did not require a response via speech in contrast to the SPD, which required a verbal (oral) response.
NDAPD task
The participants were asked to respond by pointing to 21 sets of pictures (four pictures per card) that represented the 21 test items. The items were arranged in increasing syllable complexity, including deletion of initial and final consonant singletons and clusters. Each of the 21 sets of pictures consisted of one correct response and three foils. For example, the stimulus item contained four pictures: “car, yard, card, park” shown in line on one card (stimuli=card without /d/, target= car) (Appendix B).
Prior to the administration, each participant looked at each set of stimulus items (four pictures per card) one at a time. The researcher named each picture on the card for all sets of pictures, in random order, and asked the participant to point to each picture as it was named. If the participant did not point to the correct picture after it was named and pointed to 5 times by the researcher, the test was discontinued and the child was excluded from the study. No participants were excluded because they did not point to the correct picture named by the researcher.
After all of the pictures were presented and comprehended, an example, two practice items, and the 21 stimulus items were administered (Refer to Appendix C). The systematic prompting and scoring system developed by Gillam et al. [26] was used to provide feedback if the participant responded incorrectly. The scores provided to the participant ranged from 1 (responded after no prompt) to 5 (responded after maximum prompting). The total possible score ranged from 21 (all correct) to 105 (maximum prompts needed). General instructions given for each item were as follows: “Listen carefully; I am going to say a word and leave off a sound. When I leave off the sound, a real word will be left over. The real word that is left over is one of the words on the card (pointing to pictures on the stimulus card). Ready?”. For stimulus number 1, the researcher said the first prompt, “mice without /m/ is ______.” If the participant pointed to the correct picture after hearing the first item, this was scored 1 and no further prompts were given. If the participant pointed to a picture other than the correct response, or foil type, specific prompts were given as follows:
Foil type 1, Same picture as the stimulus; the researcher said, “No, (stimulus; mice) without /m/ isn’t (same; mice). Mice and mice are the same word.” The researcher pointed to each picture as they were named and said, “Listen (mice - mice). I want you to show me which picture is (stimulus; mice without [sound] /m/).”
Foil type 2, Similar picture as the stimulus; the researcher said, “No, (stimulus; mice) without /m/ isn’t (similar; dice). Mice and dice end with the same sound.” The researcher pointed to each picture as they were named and said, “Listen (mice /sssss/, dice /sssss/ highlighting the part of the similar word that is the same as in the stimulus word). I want you to show me which picture is (stimulus; mice without [sound] /m/).”
Foil type 3, Dissimilar; the researcher said, “No, (stimulus; mice) without /m/ isn’t (dissimilar; eye). Mice and eye have the same middle sound.” The researcher pointed to each picture as they were named and said, “Listen (mice /aI/, eye /aI/). I want you to show me which picture is (stimulus; mice without [sound] /m/).” If the participant chose the same incorrect answer more than once, the foil type response was given.
The prompting system corresponded to a scoring scale that ranged from 1 to 5. This system allowed for the documentation of the number of prompts the participant needed before the correct answer was obtained. A participant was provided prompts based on their response to each stimulus. A participant could receive up to 5 prompts, which included hearing the first item, for each stimulus item if needed.
The following scoring system was used:
Score of 1=correct answer after hearing the first item and no further prompt was given.
Score of 2=correct response after 1 foil type prompt.
Score of 3=correct response after 2 foil type prompts.
Score of 4=correct response after 3 foil type prompts.
Score of 5=correct response after 4 foil type prompts.
SPD task
The SPD (Appendix A) [26] was administered to the participants. The SPD utilized the same 21 test items in the NDAPD, however, the test items were presented verbally (orally) without pictures and a verbal (oral) response was required. For example, the participant was asked to tell the researcher what the word was after deleting a sound, such as “say the word mice without /m/.” This task consisted of 21 one-syllable words that measured correct verbal (oral) production of the target response. One training item and two practice items with corrective feedback were given prior to the stimulus items. Corrective feedback was not given during administration of the 21 stimulus items. All 21 stimulus items were administered. A correct answer was scored a 1 if the participant responded with the correctly articulated word. An incorrect answer that did not mimic the correctly articulated word was scored a 0. General instructions given for each item were as follows: “Listen carefully; I am going to say a word and leave off a sound. When I leave off the sound, a real word will be left over. When I leave off the sound, a real word will be left over. Tell me the real word that is left over. Ready?” For stimulus number 1, the researcher said the first prompt, “mice without /m/ is ______.”
Data scoring
Prior to administration of the PA tasks, the participants were assigned a number from 1 to 60. To control for order effects, the odd numbered participants were administered the SPD first and the even numbered participants were administered the NDAPD first. All of the sessions were audio recorded using a Sony ICD-PX312 Digital Flash Voice Recorder. Each standardized assessment was administered according to the standard protocol explained in the test manual. The participants’ verbal (oral) responses of the GFTA-2 and the SPD were broadly phonetically transcribed using the phonetic symbols of the International Phonetic Alphabet (IPA). Because the PPVT-4, PTONI, and NDAPD required a nonverbal (non-oral) response, answers were recorded on the protocols by the researcher after the participant responded to each stimulus item.
Scoring fidelity
The first author and a licensed SLP blind to the study listened to a random 10% of the audiotapes of the verbal (oral) responses on the GFTA-2 and SPD. Inter-judge reliability was 99% and 100% respectively. Intra-judge reliability assessed by the first author on two separate occasions was 100% for both measures. The first author and a graduate student rescored 10% of the PPVT-4, PTONI, NDAPD protocols. Point-to-point percentage agreement for the number of correct productions and number of errors was calculated with the following formula: [total agreements/(total agreements+total disagreements]. Inter-judge reliability was high for the PPVT-4 (95%), PTONI (100%), and NDAPD (100%). Intra-judge reliability was high for the PPVT-4 (100%), PTONI (98%), and NDAPD (100%).
RESULTS
The results are presented below according to the three questions posed in this investigation. Statistical comparisons and a summary of results can be found in Tables 3, 4, 5, and 6.

Means, Standard deviations, and Minimum and Maximum Scores for the Assessments by Group
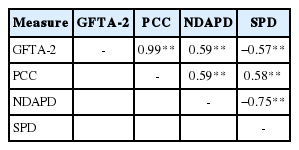
Pearson Product-Moment correlation coefficients
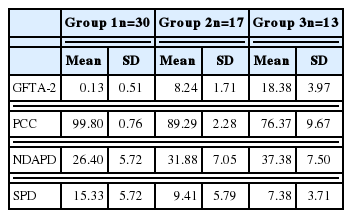
Means and Standard Deviations for the by SSD Group by Severity

ANOVA Summary Table
Relationship between speech sound production and PA proficiency
To answer the first question, “Is there a significant correlation between speech sound production and PA performance among learners (i.e., SSD vs. TD)?”, Pearson Product-Moment Correlation Coefficients were calculated. The raw scores (number of errors) from the GFTA-2 and PCC were compared with the raw scores on the NDAPD and SPD. The raw scores on the NDAPD ranged on scale from 21 through 105 and on the SPD from 0 through 21. Thus, a high score on the NDAPD indicated weak performance on PA skills, whereas, a high score on the SPD indicated strong PA skills. There was a moderate, positive significant correlation (n=60) between the number of speech sound errors (GFTA-2 raw score) and performance on the NDAPD (r=0.59), suggesting participants with higher raw scores (more speech sound errors) had higher scores on the NDAPD. There was a moderate, positive correlation between PCC and the SPD (r=0.58), suggesting participants with a lower PCC (more speech sound errors) had lower scores on the SPD. The participants who had more difficulty on the measures of speech sound production also had more difficulty with both phoneme deletion tasks. Additionally, there was a moderate, negative correlation between the GFTA-2 and the SPD (r=−0.57), suggesting the more speech sound errors a participant exhibited, poorer verbal (oral) PA skills were demonstrated.
Differences between participants with and without SSD
To answer the second question, “Is there a significant difference in the performance of learners with and without SSDs on oral response or non-oral response PA tasks?”, a comparative analysis was conducted using a two-way ANOVA, groups by conditions; two groups (SSD and TD) by two conditions (NDAPD and SPD), to determine significance and interactions. The participants’ raw scores on the NDAPD and the SPD were transformed into percentages and served as the dependent variable. Partial eta squared is reported, of which .01 is small, 0.06 is medium, and 0.14 is large, to characterize the magnitude of effects.
A significant main effect was shown for group [F(1, 58)=20.54, p<0.01, partial η2=0.26] and test [F(1,58)=111.02, p<0.01, partial η2=0.66]. The participants who exhibited SSD performed more poorly than did the participants who were typically developing on both tasks. A significant interaction was shown for group and test [F(1, 58)=21.05, p<0.01, partial η2=0.27]. There were differences between the NDAPD and SPD across the participants with SSD and those without. A significant main effect was shown for the TD and SSD groups on the SPD [F(1,58)=26.68, p<0.01] and the NDAPD [F(1, 58)=20.37, p<0.01]. The participants in the SSD scored more poorly than did the participants in the TD group on both the SPD and the NDAPD.
Differences based on the severity of SSD
To answer the third question, “Does SSD severity impact PA skills?”, a two-way ANOVA was conducted, groups by conditions; three groups (severity) by two conditions (NDAPD and SPD) to determine significance and interactions. The PCC was divided by the following degrees of severity: 1) group 1 (> 2 errors) had a score of 97% or above; 2) group 2 (mild) had a score between 96% and 85%; and 3) group 3 (moderate) had a score below 85%. Table 5 reflects mean raw scores for the GFTA-2, SPD and NDAPD, and PCC for the three groups.
The results of the ANOVA were significant for the SPD [F(2, 59)=13.96; p=0.000] and the NDAPD [F(2, 59)=13.56; p= 0.000]. There were significant differences between group 1 (TD) and group 2 (mild) and between group 1 (TD) and group 3 (moderate) on the NDAPD (p<0.05). There were significant differences between group 1 (TD) and group 2 (mild) and between group 1 (TD) and group 3 (moderate) on the SPD (p<0.05). However, there were no significant differences between the two groups of participants with SSD (groups 2 and 3) on the NDAPD or the SPD (p>0.05). Table 6 shows the results of the ANOVA.
DISCUSSION
This study was designed to explore the relationship between speech sound production and PA tasks in children with and without SSD. Answers to questions posed in this study contribute to the understanding of the nature of SSD and its relationship to PA and the use of a dynamic assessment using a graduated prompting system (NDAPD) that did not require a verbal (oral) response. Given that the most common tasks used to measure PA require a verbal (oral) response, it makes the evidence difficult to apply to children with SSD [4]. The NDAPD was included in this study because it (1) did not require a verbal (oral) response from the children and (2) included an error-specific graduated prompting system. Graduated prompting systems used in dynamic assessment allow for children to receive incremental levels of support to perform a task [27] and thus, encourage a child’s modifiability, or ability to change given this form of support [35,36].
Relationship between speech sound production and pa proficiency
The results indicated a moderate, positive significant correlation between SSD and PA (r=0.59). The children who exhibited speech sound errors had more difficulty completing PA tasks. Additionally, a strong correlation was also found between the two PA measures (i.e., NDAPD and SPD) (r=−0.75), suggesting that these measures asses PA proficiency, regardless of whether a verbal (oral) response or nonverbal (non-oral) response was required. These results are similar to those found by Claessen et al. [25] and Gillam et al. [26] who reported high correlations between PA measures that do or do not require a verbal (oral) response.
Differences between participants with and without SSD
The results indicated a difference between the performance of children with and without SSD on PA tasks. The children who exhibited SSD scored more poorly than did the TD children as evidenced by a significant main effect (p<0.01). This extends the work of other researchers who also found that children who have SSD show difficulties with PA [4,37,38]. The children with SSD, even with the error-specific prompting that was provided on the NDAPD, had more difficulty with performing phoneme deletion tasks, suggesting that these children with SSD may have not fully developed underlying phonological representations to perform higher-level PA tasks [38].
Differences based on the severity of SSD
There were not significant differences between the children with mild SSD and moderate SSD (p>0.05). Although there was no attempt in this study to determine causes of the SSD in the participants, this particular component has clinical importance for early identification and intervention for preschool and early elementary children. It also reinforces the notion that children with non-developmental speech sound errors need preventative PA intervention, as all of the participants in this study with SSD, regardless of the severity, had difficulty demonstrating PA skills. This result is consistent with Cowan and Moran’s work (1997) suggesting that even children with mild SSD are at risk for PA development. Further, the children with SSD performed more poorly on the SPD than the NDAPD.
Clinical Implications
The findings from this study of participants with SSD and their PA proficiency have a number of clinical implications. First, the NDAPD is a relevant and valid tool to investigate phonological representations in children who are unable to produce accurate verbal (oral)speech sound production, such as those with SSD. This study reinforces the earlier findings by Gillam et al. [26] and demonstrates the NDAPD as a measure to use for phoneme deletion providing an alternative PA assessment for individuals for whom verbal (oral) measures are contraindicated. Additionally, a strong, negative correlation was also found between the two measures of phoneme deletion (r=−0.75) (i.e., as scores increase on the NDAPD, scores decrease on the SPD). While static measures of phoneme deletion have been demonstrated to be valid measures of PA [16, 20,23,36], the strong correlation between the two measures suggests the NDAPD as an acceptable measure of PA proficiency.
Second, using both the NDAPD and the SPD in combination could provide insight into a child’s input processing skills and phonological representations. For example, a lower score on the NDAPD would reflect that the child has adequate underlying phonological representations and does understand how to complete higher-level PA tasks. On the other hand, poor performance on both the SPD and NDAPD would reflect poorly specified phonological representations that have an effect on the ability to complete higher-level PA tasks. This information can be used to develop the focus of interventions to include the development of specific phonological representations, which aids in the development of decoding ability.
Third, the NDAPD is available for SLPs to use as a measurement of PA for children who have difficulty responding verbally (orally). Verbal (oral) measures of PA do not provide a way to score responses when they differ from the norm. The use of the NDAPD would be beneficial with children who are speech that is difficult to understand or those or are non-speaking (e.g., childhood apraxia of speech or complex communication needs).
Finally, it is important to gather accurate information about children’s PA ability because of the strong correlation that exists between PA and reading ability. This can be accomplished by assessing PA skills in children who exhibit SSD in order to consider their potential for deficits in PA, which would impact the development of their reading skills. The NDAPD may be more useful than a traditional, static assessment of PA because it can provide both diagnostic and prescriptive information by analyzing the kinds of errors that the children are making. This information can then be used to design and provide intervention in this area.
Limitations and future research
First, the current study did not include a reading measure. Previous research has shown a strong correlation between PA and reading ability [16,26,38]. Future research should include an assessment of decoding ability in children with SSDs and might determine correlations between phoneme deletion assessed on the NDAPD and reading in children with SSDs.
Secondly, future investigations should consider using the NDAPD to assess PA skills in other children who have difficulty producing verbal (oral) speech, such as children who are non-speaking. Children who are non-speaking have difficulty developing age-appropriate reading skills [39]. Given that poor PA skills have been linked to poor reading skills, information about underlying phonological representations in children who are non-speaking can guide instruction in PA and reading.
Thirdly, the children in this study exhibited intact receptive vocabulary skills as measured by the PPVT-4. No additional language assessment was completed. Moreover, a measure of reading was also not included in this investigation. Future investigators should consider an assessment of all areas of language to determine if children with SSD have accompanying language and/or reading impairment. This could further quantify the effects of SSD on phonological deletion proficiency.
CONCLUSIONS
This study has made an important contribution by being the first to examine phoneme deletion proficiency in a large group of children with SSD. The results are promising, suggesting that this type of assessment is beneficial for assessing the underlying phonological representations in children who are unable to provide an accurate verbal (oral) response. The NDAPD provided additional information about what type of errors the children exhibited which can help to develop appropriate interventions for improvement in PA, which in turn, can affect later reading skills.
ACKNOWLEDGMENTS
The research was in part funded by the Office of Special Education Programs Federal Program, University of Central Arkansas Communication Sciences and Disorders Leadership Education Grant # H325D090058.
References
Appendices
Appendix A Static Phonemic Deletion Measure
One example and 2 practice items will be used. Examiner: “Listen carefully; I am going to say a word and leave off a sound. When I leave off the sound, a real word will be left over. Tell me the real word that is left over. Ready? Card without /d/ is car. Now, you say the real word that is leftover after I leave off a sound. Say throw without /θ/”. If correct, move to practice B. If incorrect, examiner: “Throw without /θ/ is row. Now, you try one. Say pink without /k/”. Repeat corrective feedback if child is incorrect. Continue with test items. No corrective feedback is given for items 1 through 21. Give all stimulus items.
Practice A: throw /θ/ = row Practice B: pink /k/ = pin
Scoring: 1 for correct response, 0 for incorrect response. “Say _____ without / /”.

Appendix B Example of Nonverbal, Dynamic Phoneme Deletion Picture Sets
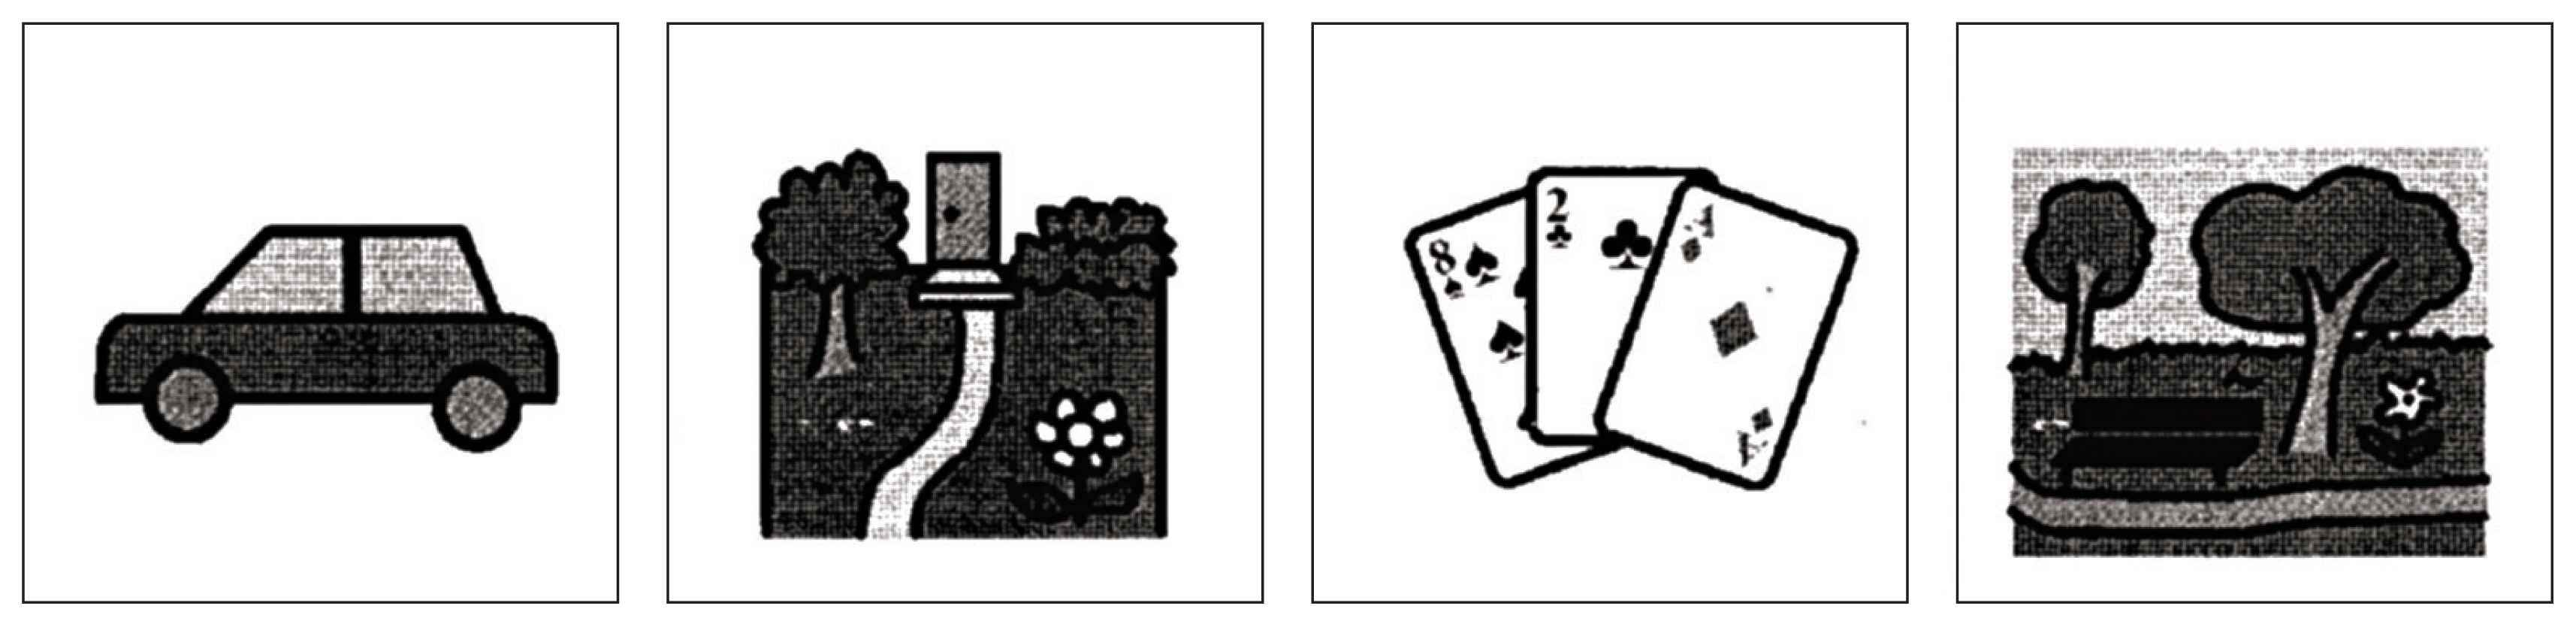
Card without /d/ is ___________
