Emotional reactions of people who stutter in difficult communication situations: a preliminary study
Article information
Abstract
Purpose
Few studies have examined the emotional responses of adults who stutter (AWS) in specific situations. The aim of this study is to determine the emotions of AWS in different communication situations at various times in communication.
Methods
The study included 38 AWS. The first stage of the study determined the difficulties related to stuttering in communication situations by requiring the participants to complete a questionnaire consisting of open-ended questions. The four SLTs scored these situations from various aspects (e.g., common experience of difficulty for AWS) and the final version of the 19-item list of situations in the “Determining Emotions Regarding Communication Situations in Stuttering Questionnaire (DERCSQ)” has been reached. The DERCSQ also provided a list of 90 emotions related to communication situations and stuttering. The participants completed the DERCSQ by indicating their feelings in three communication situations (before, during, and after communication).
Results
The results indicated that AWS frequently experience negative emotions in different communication situations. The participants indicated that they experience the following emotions in pre-communication: excited (194), anxious (143), restless (142), tense (128), and concerned (118). During the communication, the participants experience the following emotions: uneasy (90), excited (88), uncomfortable (81), insufficient (78), and restless (75). During the after-communication period, the participants indicated that they experience the following emotions: anxiety (38), uneasy (34), uncomfortable (34), insufficient (33), and self-rage (32).
Conclusions
The emotions obtained are compatible with the stuttering and psychology literature, it is remarkable that emotions such as anxiety and uneasy after stuttering were prominent.
INTRODUCTION
The stuttering experience and its relation to emotions
Adults who stutter (AWS) experience social, academic, and professional difficulties because of the disruptions in their fluency [1]. These different communication experiences affect AWS throughout their lives, and they may develop negative emotions and behaviors in response to the challenges they encounter in social situations [2]. Anxiety can develop as a part of AWS’s daily life as a result of these social interactions [2,3]. The daily lives of AWS are also affected by the difficulties they experience in establishing social relations, as well as the severity of their stuttering and their personalities and thoughts. These social experiences and their difficulties can differ to the relation itself. As the negative thoughts and emotions of AWS related to their stutter increase, they experience more difficulties communicating in their daily lives [4]. Boyle and Gabel [5] concluded from their study that AWS often abstained from talking on the phone, raising their hands in class, speaking in crowded environments, and expressing their thoughts and emotions in communication situations. These limitations prevent AWS from participating in daily life and communicating with others. In fact, individuals who stutter have explained that because they are left behind in social life, they feel incompetent, which negatively affects their life [5].
AWS explain that their stuttering experiences vary depending on the social situation [5–7]. For example, AWS state that it is easier for them to talk when they are alone compared to talking in front of a group of people [6]. In particular, the following factors may affect the speaker’s stuttering experience, thoughts and emotions about communication situations: (a) the listener’s age and affinity with (b) degree of importance to the speaker as well as the speaker’s personality (c) his or her anxiety about the intended message [8,9]. These variations of stuttering experience are also affected by the emotions during that social event [6].
In literature stuttering is frequently associated with emotions such as fear, anxiety, worry, disappointment, embarrassment and tension [5,6,8–14]. Previous studies have shown that stuttering is specifically associated with embarrassment and the fear of being disgraced [6,15,16]. In addition to these emotions, the negative thoughts that AWS experience in social situations make them feel uncomfortable when communicating with others [16]. Research has indicated that exposure to negative attitudes about stuttering increases the negative emotions related to stuttering in AWS [9,11,14,17].
Emotions related to stuttering in the context of culture
Various factors, such as specific communication situations and cultural factors, affect the emotions that individuals feel in social situations [18,19]. For example, individuals raised in the Turkish culture feel emotions of guilt and embarrassment more frequently than those raised in the cultural environment in the Netherlands [19]. Ozdemir et al. [20,21] and St. Louis et al. [22] conducted studies that showed that people have negative emotions toward stuttering in the Turkish culture and display negative attitudes toward AWS. Thus, culture also affects the emotions that AWS experience in communication situations. Similarly, Cangi and Alpay [23] found from their study that Turkish participants display more behaviors, such as “completing sentences and consecutively asking questions” in comparison to non-Turkish participants, and this tendency affects the anxiety levels of AWS. Thus, exposure to the types of negative attitudes highlighted in these studies can affect the emotions of individuals who stutter and who are raised in the Turkish culture.
Purpose
To better understand the effects of stuttering on social life many authors suggested the emotional statuses of AWS in different communication events [6,7,9,24]. Thereafter, the difficult situations and emotions that AWS experience during various periods of communication should be examined and addressed in the intervention process [e.g., 14,25]. Timing based (e.g., before, during, and after communication) investigation of the stuttering may help us better understanding of how emotions work in communication situations. Different communication situations are evoking the different emotions [6]. So, it would be important to evaluate different communications situations for understanding the perspective and experience of AWS. Timing based emotional scoring of AWS in different communication situations may help SLPs for understanding the underlying treatment process. Many situations have varying degrees of emotions, the individual with stuttering feels various emotions in communication situations. The literature review included studies that examined the emotions of AWS, especially in English-speaking populations. However, no available studies have investigated the emotional experiences of AWS in Turkey. Hence, the present study aimed to investigate the emotions and the degree to which Turkish AWS feel these emotions before, during, and after stuttering in communication. In addition, the study aimed to examine these emotional choices and their intensity in terms of certain demographic variables and qualities related to different communication situations. The study sought to answer the following questions:
What emotions and to what degree do individuals who stutter feel in the three stages of communication (before, during, and after communication/stuttering)?
Do the mean scores of individuals who stutter relate to their emotional reactions before, during, and after communication and vary according to their sociodemographic characteristics and therapy history?
METHODS
Participants
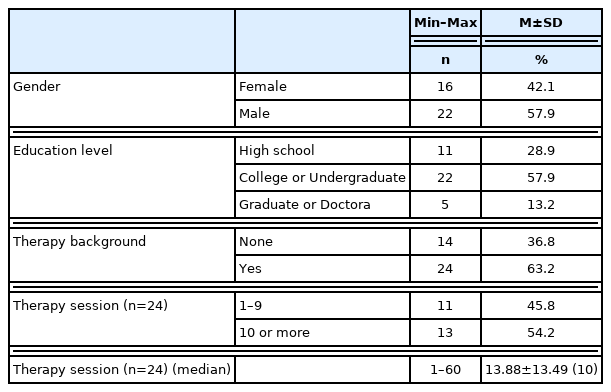
The study participants consisted of 38 (16 females, 22 males) adult individuals who had developmental stuttering (Table 1). The inclusion criteria determined within the scope of the study were: a) having developmental stuttering which started before the age of seven, b) being 18 years old and above, c) not being diagnosed with a neuropsychiatric disease and not taking drugs related to this disease, d) not having any linguistic and speech disorders other than stuttering. For these criteria, the declarations made by the cases were accepted as true.
Demographics
Ethical approval for the study was obtained from the Ethics Committee of Uskudar University with the decision dated 01/28/2021 and numbered 61351342/ 2021-73.
Data collection tools
Sociodemographic information form
This form includes questions inquiring about gender, age, educational level, history of linguistic and speech therapy, presence of a psychiatric disorder such as social anxiety disorder (social phobia), history of psychiatric therapy, and status of using psychiatric drugs. These demographic information’s were taken as independent variables in the study.
Determining emotions regarding communication situations in stuttering questionnaire (DERCSQ)
The questionnaire was developed by the authors in order to determine the emotions that adult individuals who stutter feel in various communication situations. The questionnaire is made up of 19 items under three subscales (before communication – 9 items, during communication – 7 items, after communication – 3 items). The participants were asked to match each item with 90 emotions.
Determination of DERCSQ communication situations
In the study, the questionnaire development method of Robson [26] was used. In the development stage of DERCSQ, 20 AWS were asked to write down five communication situations which they encountered and experienced the most difficulty in academic, professional, and social environments. Authors classified total 100 situations according to their frequencies. After that, they grouped as before communication, during communication, and after communication. This grouping was performed by four different speech and language therapists (SLP) in order to avoid bias. By examining the literature on stuttering, communication situations were revised in proper forms [8,27,28]. In the final stage of the questionnaire development, an SLP specialist and faculty member checked the categorization and linguistic cohesion of the items. Specialists check the items to the following criteria’s;
Compatible with daily life of AWS
Compatible with the stuttering literature
Compatible with the Turkish language and Turkish culture
Compliance with the purpose of the research
Thus, the first format of 19-item DERCSQ was created (Annex 1).
Pilot study
The first format of DERCSQ was presented to five individuals who stutter, and they were asked to score the questionnaire items with a Likert type scoring system (1- Not Suitable At All, 2- Not Suitable, 3- Suitable But Needs To Be Changed, 4- Suitable, 5- Definitely Suitable). The items with a mean score of 3, 4, and 5 were used in the later stages of the study. All items within the scope of the study were scored higher than the average and used in the study. The items who get between 3–4 points were revised and added to the final form of the DERSQ. The scores given to the DERCSQ items by the participants in the pilot study were presented in Table 2.

DERCSQ items points of the pilot study
Creation of DERCSQ list of emotions
The list of emotions was prepared by reviewing the literature on stuttering. In determining the emotions, the studies conducted by Gem [29], Plutchik [30], and Guntupalli et al. [15] were benefited from. There are 90 emotions in the list (Annex 2). The list of emotions was prepared objectively, listed alphabetically, and includes both positive and negative emotions. All possible Turkish counterparts of the emotions indicated in the English stuttering literature were included (e.g., “utanç” for shame, “kaygı” for anxiety, “öfke” for rage (against self and others), “endişe” for concern, etc.).
Data collection procedure
Before presenting the questionnaire to the participants, their informed consent form was taken, and then, they were administered the sociodemographic information form. In filling out the questionnaire, the participants were asked to choose among 90 emotions for 19 communication situations. 90 emotion tables are presented in the continuation of each communication item. Every participant filled 19 different emotion table for each communication item. After making emotion choices for each item, they were also asked to score the severity of the emotions they choose for each communication situation on a 10-point scoring system (1 – I feel it very little, 10 – I feel it at a severe level). These data are also added to the analysis separately.
Analysis of DERCSQ data
In order to determine of the AWS’s emotions in the communication items (pre-communication, during communication and after-communication), the emotions they chose in the emotion list were calculated in the pre-communication (nine items), during communication (seven items) and after-communication (three items) groups. Emotions were calculated separately for the three communication times. For this;
The emotion/emotions chosen by each participant for each item were calculated. Ranking was carried out from the most chosen emotion to the least chosen emotion.
The number of emotions selected for an item was calculated and compared according to demographic characteristics.
Scores from 1 to 10 of the selected emotion expressions were also collected.
These scores were also compared according to socio-demographic characteristics.
Statistical analysis
For the statistical analysis of the study data, IBM SPSS Statistics 22 (IBM SPSS, Turkey) software was used. The normal distribution of the parameters was tested through Kolmogorov-Smirnov test. In addition to descriptive statistical methods (mean, standard deviation, and frequency), in the comparison of quantitative data, One-Way ANOVA test was used in the intergroup comparison of the parameters with normal distribution. In the intergroup comparison of the parameters without normal distribution, Kruskal-Wallis test was used, while Dunn’s test was employed in determining the group that created the difference. In the comparison of the parameters with normal distribution between two groups, Student’s t test, and in the comparison of the parameters without normal distribution, Mann-Whitney U test were used. Pearson correlation analysis was employed in examining the parameters that showed normal distribution. Significance level was evaluated at p<0.05.
RESULTS
In this section, information about the emotion terms that the individuals who stutter chose among the communication situations and the questionnaire items is presented, respectively. At the same time, information on some items were also shared in Table 3.

The DERCSQ items that participants scored most and least
Analysis of chosen emotions related to before, during, and after communication on DERCSQ
The first 20 emotion terms that the participants chose the most in the questionnaire items related to before, during, and after communication are presented in Table 2.
It was determined that five emotions that the participants chose the most in the items related to before communication were Excited, Anxious, Restless, Tense, and Concerned, in the items related to during communication, the most chosen emotions were Uneasy, Excited, Uncomfortable, Insufficient, and Restless, and regarding the items related to after communication, the five items that they chose the most were Anxious, Uneasy, Uncomfortable, Insufficient, and Self-Rage.
The number of emotions chosen and scores regarding the emotions before, during, and after communication with respect to the participants’ demographic characteristics
In Table 3, the comparison of the participants’ choices and emotion scores on before, during, and after communication items on DERCSQ with respect to gender is presented. No statistically significant difference was found between the lowest score, the highest score, the highest number of emotions chosen, and the least number of emotions chosen with respect to the participants’ gender (Mann-Whitney U test; p>0.05).
In Table 4, the comparison of the number of emotions chosen and emotion scores in before, during, and after communication on DERCSQ with respect to their educational status is presented. A statistically significant difference was found in the participants’ highest scores related to during communication with respect to their educational status (Kruskal-Wallis test; p=0.046<0.05). This difference resulted from the highest scores of high school graduates and those of the participants with postgraduate degrees (Mann-Whitney U test; p=0.047<0.05). A statistically significant difference was determined between the highest number of emotions chosen during communication (Kruskal-Wallis test; p=0.035<0.05). This difference stemmed from the difference between the highest number of emotions chosen by high school graduates and the highest number of emotions chosen by the participants with master’s or doctoral degree (Mann-Whitney U test; p=0.036<0.05). Other than these, there was no statistically significant difference between the participants’ lowest scores, highest scores, the highest number of emotions chosen, and the least number of emotions chosen with respect to their educational status (Kruskal-Wallis test; p>0.05).

Frequency table regarding the emotions chosen in the items related to before, during, and after communication
In Table 5, the comparison of the number of emotions chosen and emotion scores in before, during, and after communication on DERCSQ with respect to the participants’ therapy history is presented. No statistically significant difference was found between the participants’ lowest scores, highest scores, the highest number of emotions chosen, and the least number of emotions chosen related to before, during, and after communication with respect to their therapy history (Mann-Whitney U test; p>0.05).

Comparison of the scores on before, during, and after communication situations with respect to gender
The comparison of the participants’ highest scores, lowest scores, the highest number of emotions chosen, and the least number of emotions chosen related to before, during, and after communication on DERCSQ with respect to their number of therapy sessions is presented in Table 6. There was no statistically significant difference in terms of the highest and lowest score and the highest number of emotions chosen before, during, and after communication with respect to the number of therapy sessions (p>0.05) (Table 7). The least number of emotions chosen by the group with the number of therapy sessions between 1–9 in the items related to before communication (p=0.041; p<0.05) and during communication (p=0.037; p< 0.05) was found to be statistically significantly higher than the group with the number of therapy sessions 10 and above. No statistically significant difference was found in terms of the least number of emotions chosen in the items related to after communication (p>0.05) (Table 8).

Comparison of the scores on before, during, and after communication situations with respect to educational status

Comparison of the scores on before, during, and after communication situations with respect to the participants’ therapy history

Comparison of the scores on before, during, and after communication situations with respect to the participants’ number of therapy sessions
DISCUSSION
The study examined the emotions that AWS feel in communication situations. Notably, these emotions were frequently negative. As expected, the number of emotions and their severity varied before, during, and after communication. The data from the study indicated that the emotional choices of the participants varied according to (1) the status of the person/people with whom they communicated as part of their close or distant circle, (2) the communication environment, (3) the number of people in the communication environment, (4) the temporal phases of communication, and (5) the perceived severity of stuttering.
The DERCSQ found that the emotional experiences of AWS vary in different communication situations (e.g., meeting someone new or talking on the phone). According to a study by Plexico et al. [9], the emotions of AWS vary depending on the communication environment. Similarly, Alameer et al. [8] presented nine different communication situations to individuals who stutter. The researchers reported that the participants’ anxiety scores for speaking varied in these situations. In addition, it was observed that they felt different emotions in different intensities in different communication moments and time periods. These studies support the results obtained from this research. In order to better understand this situation, it’s important to examine emotions in different time periods.
An analysis of the participants’ scoring of items before, during, and after communication on the DERCSQ indicates that the participants in the present study experienced fewer emotions with less severity in the item “Before speaking to people in my immediate circle” (Item 3). However, the participants selected more emotions and indicated a higher emotional severity for the item “Before speaking in front of an audience” (Item 1). Consequently, the findings indicate that the number of people in the communication environment and the relationship between the AWS and the listener affect the emotions of AWS. The participants chose the highest number of emotions and indicated the highest severity of emotion for the during-communication item “When I think that I cannot express myself clearly due to my stuttering” (Item 11) and the after-communication item “When I make a speech that contains too much stuttering” (Item 17). Researchers have explained that the thoughts in different social situations determine the emotions [8,28,31–33]. So, the thoughts of AWS that they cannot display adequate fluency performance affect the number and severity of the emotions they feel related to communication.
Emotions felt in stuttering in communication situations
Alqhazo et al. [34] used a data collection tool for their study that included 10 emotions, and Guntupalli et al. [15] used a tool that contained 18 emotions. Interestingly, the lists of emotions used in these studies mostly included negative emotions. The present study used a list of emotions that included 90 emotions. In addition, the participants chose emotional terms according to 19 specific situations that aligned with the three periods of communication. Therefore, the findings obtained in the present study are more comprehensive than those of other studies. This situation gave the opportunity to examine the emotional change of stuttering on individuals. At the same time, it is thought that having both positive and negative emotions allow individuals who stutter to evaluate their choices impartially.
The stuttering literature frequently associates stuttering with emotions such as anxiety, fear, concern, and tension [5,6, 9,11,12,14,35]. Similar to other studies, the present study found that AWS frequently feel emotions such as anxious, concern, and tension in communication situations. In contrast to other studies, the present study found that AWS also frequently feel emotions such as excitement, restlessness, uneasiness, discomfort, insufficiency, and self-rage. This study identified the wide variety of emotions that AWS feel in communication situations by examining the emotions of AWS before, during, and after communication and presenting an extensive list of emotions to the participants that included 90 emotions.
The participants frequently selected “excitement” before communication, “uneasiness” during communication/stuttering, and “anxiety” after communication/stuttering. However, the five emotions that AWS chose most frequently at different communication times did not appear to be common. This suggests that the participants had a certain level of awareness about emotions and made careful choices while completing the questionnaires. To clearly understand this information, it is crucial for the present study to measure awareness of emotions. The awareness of emotions was also tried to investigate by scoring the emotions chosen by the participants from 0 to 10.
Individuals who stutter consider potential situations before communicating. Consequently, in the present study, the participants frequently chose the emotion of excitement pre-communication and during communication. This may have occurred because of the participants’ uncertainty about what type of attitude they would display considering the situation they encountered before and during communication. Previous studies have associated the emotion of excitement with future experiences, which results from the individual’s indecision about the response he or she may give in a particular situation [36].
Furthermore, embarrassment ranked among the top 10 emotions experienced after communication. The participants ranked the emotion of embarrassment after, during, and before communication from the highest to the lowest, respectively. In contrast, other studies have found that stuttering is particularly associated with embarrassment and the fear of being disgraced by listeners and AWS [6,15]. Participants chose the emotion of embarrassment less in the present study because it investigated emotions as situational reactions. However, previous studies have explained that embarrassment is a widespread emotion related to attitudes.
The findings from the present study indicate that Turkish culture affects the emotions that individuals experience. Cambria et al. [18] conducted a study to analyze emotions and found that the effect of culture should not be ignored. Hofstede [37] stated that Turkish culture has a collectivist character (i.e., group aims are superior to individual aims). Several studies have considered the effects of culture on emotions. For example, Cangi and Alpay [23] found that Turkish listeners displayed more negative attitudes and behaviors toward AWS during communication than did non-Turkish listeners. Ozdemir et al. [20,21] obtained similar results with the data from the The Public Opinion Survey of Human Attributes-Stuttering (POSHA-S) scale that measures attitudes related to stuttering. St. Louis et al. [22] examined attitudes toward stuttering in four countries by using the POSHA-S scale. The study found that Turkish individuals experienced more negative emotions toward stuttering and displayed more negative attitudes toward AWS, which affected the emotions of AWS in relation to their stuttering. For this reason, it is thought that the information obtained in the research supports and contributes to the current literature.
Analysis of the sociodemographic characteristics of the DERCSQ results
The frequency and severity scores for the emotions in the DERCSQ varied according to the educational status of the participants and the number of therapy sessions they had completed. The number of completed therapy sessions affected the number of emotions that the participants chose before and during communication. The group of participants who completed 10 or more therapy sessions chose a lower number of emotions during communication than the group who completed up to nine sessions, and this difference was statistically significant. This result aligns with the conclusions from other studies. For example, Irani et al. [38] concluded from their study that as the number of completed therapy sessions increased, the negative emotions related to stuttering decreased.
The number of emotions and the severity scores that the participants with master’s and doctoral degrees chose for the items during communication had a low statistical significance. Similarly, O’Brian et al. [39] presented eight communication situations to AWS and asked them to evaluate their perceptions of their stuttering severity. Although the researchers did not analyze emotions as a variable, they determined that as the level of education increased, the participants assigned lower scores to their perceptions of their stuttering. The fact that all participants with a master’s or doctoral degree had received at least ten therapy sessions affected this result. Hence, the educational level and number of completed therapy sessions of the participants affected the emotions they experienced during communication. Although the study did not reach a clear conclusion, it indicated that stuttering therapy may effectively reduce the negative emotions that AWS experience in communication situations.
When the items for the three temporal phases of communication on the DERCSQ were examined according to gender, no significant difference was found in any of the subscales. However, Samson et al. [40] reported in their study that stuttering negatively affected the lives of females who stutter more than males. Sells and Martin [41] found in their study that females expressed their emotions more than males. The findings of the present study do not support these views.
Limitations of the study and recommendations
The main limitation of the study is that it did not use a standard tool in the data collection process to examine emotional reactions to stuttering. As more specific scales are developed, studies should be able to reach conclusions based on more valid and reliable data. Also, details related to the type and method of therapy the participants in the study received are unknown. In addition, the study did not provide data regarding the severity of the participants’ stuttering. Considering different variables (i.e., experience, other psychological aspects, stuttering severity) related to stuttering will enable the questions to be addressed in a more comprehensive and detailed manner.
Supplementary Information
ACKNOWLEDGMENTS
This research is based on the first author’s MSc thesis (Ayşe Nur Koçak), which the second author (M. Emrah Cangi) supervised.
Notes
CONFLICT OF INTEREST
The Authors declare that there are no conflicts of interest.
FUNDING
The authors received no financial support for the research, authorship, and/or publication of this article.
STATEMENT OF ETHICS
This study adhered to the Declaration of Helsinki guidelines for experiments involving humans. The Ethics Review Committee of Uskudar University approved this study (28.01.2021 dated, 61351342/2021-73). Written informed consent was obtained from all the participants.
AUTHOR CONTRIBUTIONS
Ayşe Nur Koçak (first author) was responsible for the design of the study, data collection, analysis, interpretation of results, and drafting and writing of the paper. Mehmet Emrah Cangi (second author, corresponding author) was responsible for conception and design of the study, analysis and interpratation of results, writing of the paper, final approval of the version of the paper, and agreement to be accountable for all aspects of the work.
DATA AVAILABILITY
The datasets generated during and/or analyzed during the current study are available from the corresponding author on reasonable request.