


INTRODUCTION
Direct observation of the structure and function of the vocal fold is an important process for understanding the normal vocalization process and evaluating speech impairment. In particular, for malignant lesions such as glottis cancer, the transformation rate from premalignant lesions to malignant is 6–22% [1], which increases the severity when diagnosis is delayed, so early detection of lesions through laryngeal imaging is of utmost importance. To this end, various digital imaging techniques have been developed to obtain more accurate images of the structure and vibrational patterns of vocal fold tissue, and they are useful not only for diagnosis of lesions, but also for observing the progress of treatment [2].
Imaging technology using a laryngoscope has been continuously developed since Manuel Garcia directly observed his larynx, and high-resolution laryngeal videoendoscopy is currently the most widely used in clinical practice.
However, since the camera of laryngeal videoendoscopy is not suitable to observe the vocal fold vibrating very rapidly with the naked eye, various methods have been studied to more accurately evaluate the vocal fold dynamics and morphological evaluation such as laryngeal videostroboscopy (LVS) [3], high speed videoendoscopy (HSV) [4] and digital kymography (DKG) [5], line scanning videokymography (VKG) [6], and 2D scanning videokymography such as (2D VKG) [7] such as functional evaluation has been developed.
The LVS and HSV systems, which are commonly used in vocal fold dynamics evaluation, are easy to evaluate vocal fold vibrations, which play an important role in voice production. However, since the vocal fold vibration image of LVS is an illusion image and requires synchronization with the trigger, it is difficult to identify the mucous membrane waves of the vocal fold in aperiodic voices whose periodicity is severely collapsed [8]. HSV is recognized as a useful tool because it can directly observe the actual vocal cord vibration, but it has the disadvantage in that it takes a lot of time to save and play data[9]. Due to these limitations, DKG was developed, but there is a limitation in that only a specific line is extracted from the entire laryngeal image, and because it is obtained by post-processing HSV images, is time consuming [10].
On the other hand, unlike DKG, 2D VKG can observe the movement of the entire vocal fold in real time, thus preventing unnecessary time consuming and objectively measuring specific variables related to vocal fold vibration [11]. Compared to VKG extracting 7,200 lines/s at a resolution of 240 pixels, 2D VKG extracts full HD (1,920×1,080 pixels) images at 30 frames/s at 32,400 lines/s. And it can prevent distortion due to patient movement in VKG [12].
The tools mentioned above provide spatial or temporal information in various ways, and in order to use this information in clinical practice, a quantitative evaluation capable of quantifying vocal fold vibration characteristics is necessary. VLS [13], VKG [14], HSV [15], DKG [16,17], 2D DKG [10], and other measurement variables for various laryngeal image methods have been studied, and 2D VKG also has absence of vibration of vocal fold, duration of glottal closure, left-right asymmetry, shape of lateral peaks, laterally traveling mucosal wave, opening versus closing duration, shape of medial peak, cycle aberrations Various parameters can be used to measure the characteristics of vocal fold vibration [11,12].
These parameters can be analyzed more effectively using an analysis system. 2D VKG also needs to develop a quantitative analysis system such as analysis system of VKG [18], GAW, phonovibrogram [19], HSV [20], and DKG [15] in order to quantitatively evaluate vocal fold vibration using objective parameters.
Recently, various automatic analysis systems based on digital image processing techniques have been developed and show a high level of image recognition [15,19]. However, in automatic analysis system, the accuracy of the analysis result is often inferior even though image recognition is successful due to the influence of edge extraction algorithm, light source size and shape of the vocal fold, pathological conditions, and mucus. For this reason, automated quantitative analysis using a manual plotting technique is also recognized as an effective method [20–22]. In this study, the automatic analysis system is a system that automatically processes from segmentation and edge extraction to parameter calculation, and the automated analysis system is a system in which parameter values are calculated by designating a point in the program image. Was defined as calculating all tasks by hand.
In order to properly utilize 2D VKG in the clinical field, it is required to develop an analysis program capable of accurate and rapid quantitative evaluation. In addition, due to the lack of research by disease on 2D VKG, studies on various diseases and targets are needed for the evidence-based practice of 2D VKG.
Therefore, the purpose of this study is to develop an analysis system in which automatic and automated analysis methods are mixed for quantitative analysis of 2D VKG, and to quantitatively compare the vocal fold vibration characteristics of vocally healthy subjects and patients undergoing transoral laser microsurgery.
METHODS
Subjects
29 male patients (mean 53.2±9.8 years) diagnosed with T1–2 grade unilateral glottis cancer or unilateral laryngeal leukoplakia in otolaryngology and underwent CO2 transoral laser cordectomy January to August 2020, and 10 vocally heathy male (mean 45.0±4.8 years) males as a control group was participated in this study. Subjects whose glottal area was difficult to observe due to false vocal fold over-adduction were excluded from the study.
Instrumentation
Camera system
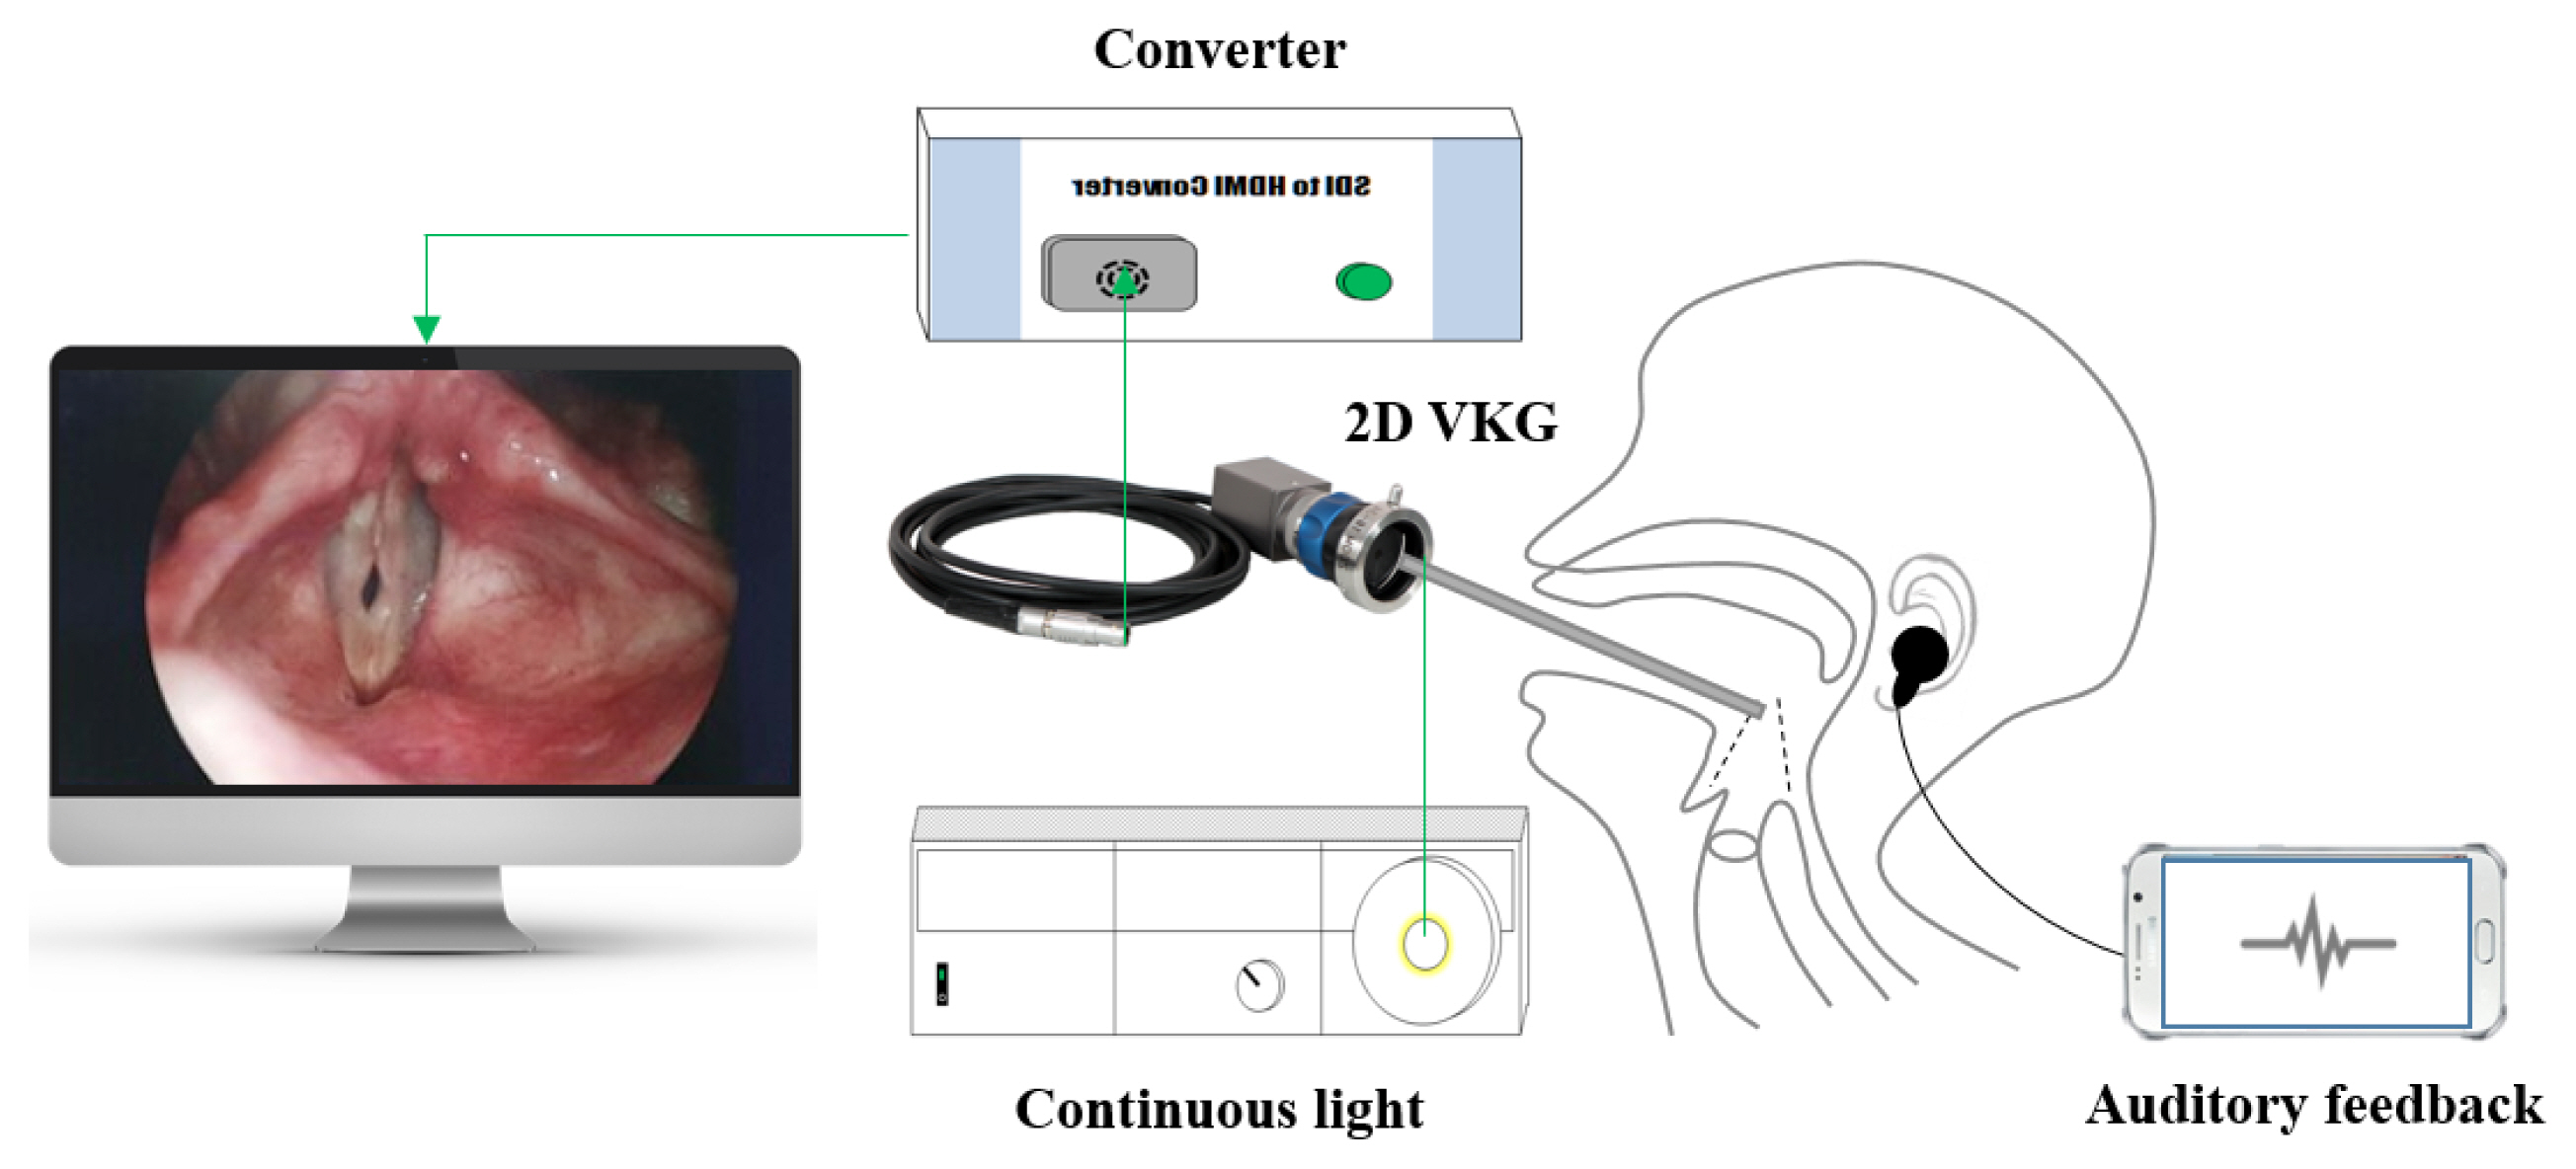
2D VKG camera (USC-710HD, U-medical, Korea) with a complementary metal-oxide semiconductor (CMOS) video sensor and rolling shutter was connected to a 4 mm rigid 70° endoscope (8700 CKA, Storz, Germany) via 16–34 mm zoom coupler (MGB, Germany). Recording was performed under illumination with a 300-watt xenon light source (NOVA 300, Storz, Germany) at a frame rate of 25 frame per second and 32,400 line per seconds, with a spatial resolution of full HD (1,920×1,080 pixel) for obtain the videokymographic images of the entire vocal fold. 2D VKG camera can be set to 25, 30, 50, or 60 frames per second, depending on the needs of the examiner. The auditory feedback was provided using the application (Function generator, Keuwl, UK) of the android smartphone (Figure 1).
2D VKG analysis program
The user interface of the program is implemented as shown in Figure 1 using C++ of OpenCV (Figure 2). The system’s software can record, play back, and save 2D VKG images as still images, and can analyze parameters by post-processing. Existing post-analysis of 2D VKG was performed using the hand-operated method on still images, but it is difficult to properly analyze the dynamic movements of the vocal fold in a single image, so analysis on images is required and automated analysis is required. In this study, for this purpose, a method of automatically extracting a kymographic region from a video without conversion to a still image was used, and a moving kymographic image was corrected using a tracking algorithm (Figures 2–5). Edge extraction and parameter calculation are performed automatically for each frame of the image, and automated analysis that corrects the edges using a manual plotting technique is possible if necessary.
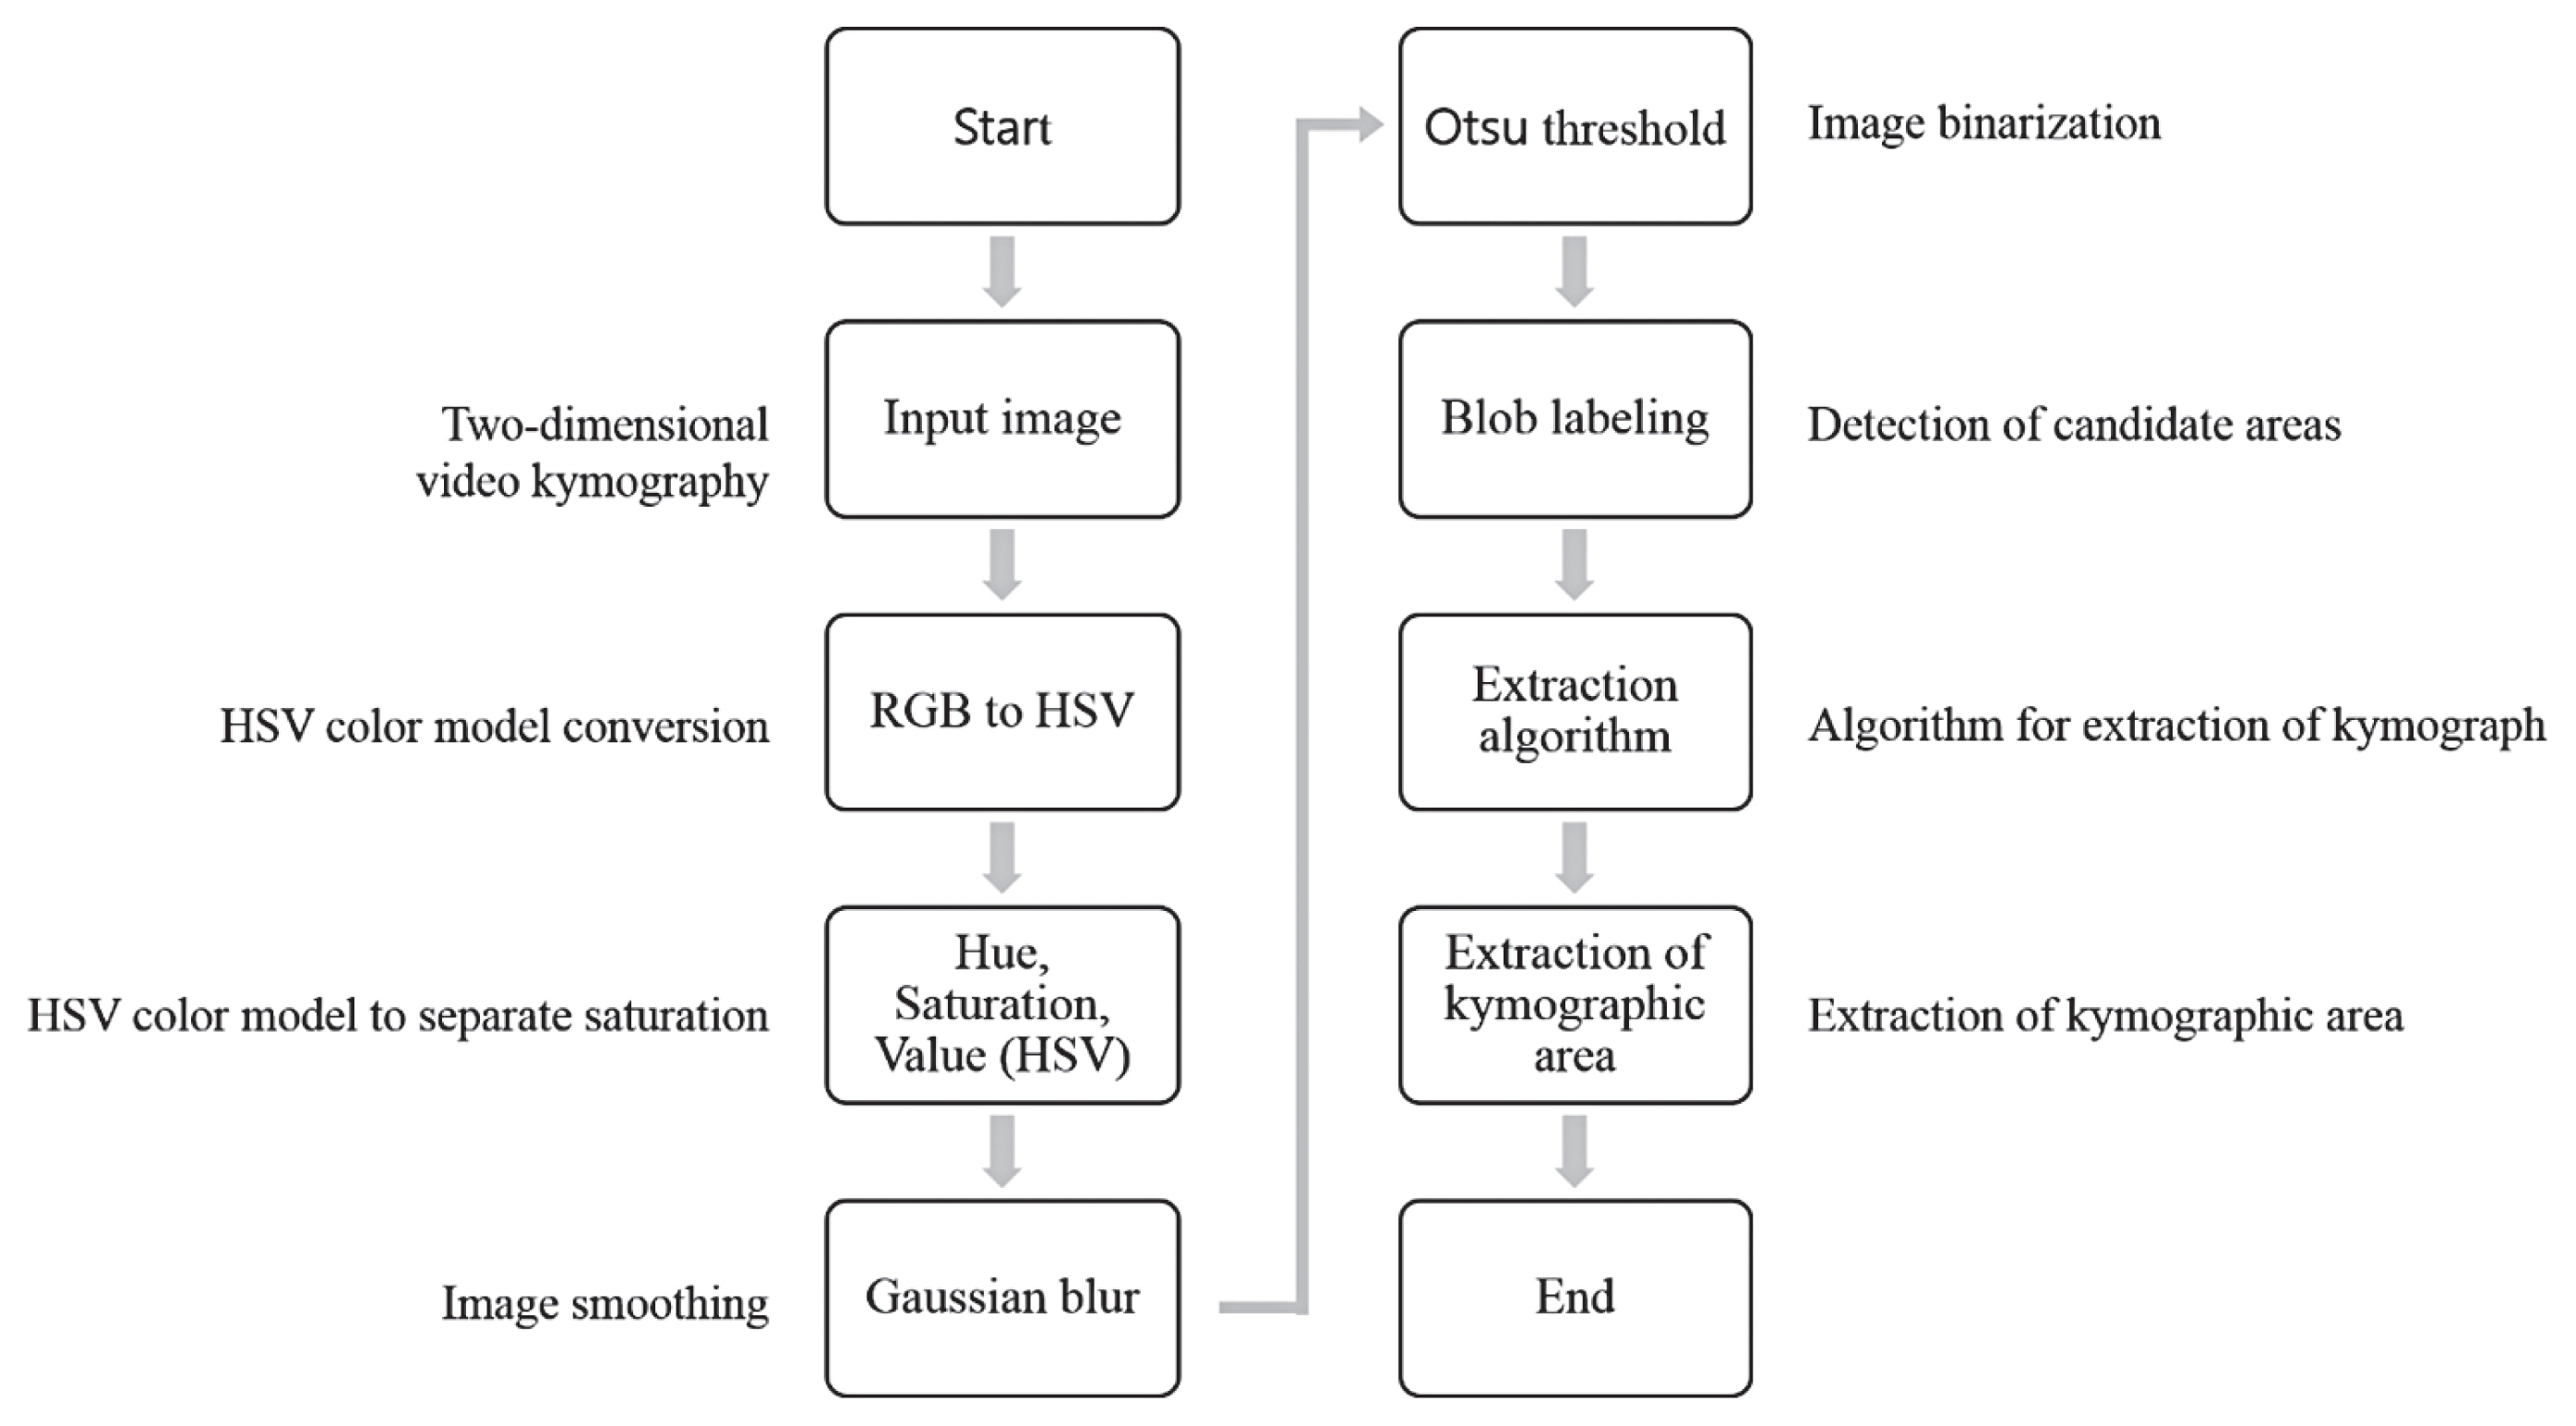
In order to analyze the video of 2D VKG, analysis was performed by dividing into image processing steps as shown in Figure 3. In this study, the Hue, Saturation, Value (HSV) color model conversion was used to identify the problems of the Red Green Blue (RGB) color conversion model and improve the reliability of the image. First, each color object is declared from the image in the input image and the reference image, and the value of each HSV is extracted using the color object. The extracted HSV value is divided through a threshold value corresponding to an angle, and is stored in respective arrays corresponding to the input image and the reference image. The values of each array are summed and converted into absolute values, compared with the reference value, and if the corresponding reference is exceeded, it is extracted as a key frame.
After inversely converting the 2D VKG image to gray scale, image blur by Gaussian profile was performed in order to blur the reflection and bright appearance of liquid secretions present in the vocal fold due to a strong light source (Formula 1).
After that, the objects contained in the image were separated using Otsu’s method to obtain 2D VKG image information from the image. Otsu is used to perform image thresholding based on automatic clustering or to reduce grayscale images in binary images. Using statistical methods, the total variance can be expressed as the sum of within class variance and between class variance (Formula 2).
Yan, Chen, and Bless (2006) calculated the global threshold from the intensity histogram of the entire image, but in this study, segmentation was performed by applying the Otsu’s method to the intensity histogram only inside the region of interest.
A sequential algorithm was used for connected component labeling to separate and display each independent area of a binary image by its own label value. Binaryization was performed on the videokymography image to generate a binary image, and blob coloring was performed on the generated binary image, and the results were checked.
Data acquisition
2D VKG examination were performed on subject who underwent CO2 laser microsurgery and subject with vocally healthy, and subjects with post CO2 laser microsurgery were examined one month after surgery. In order to acquire 2D VKG imaging, an endoscope was inserted into the subject’s oral cavity by otolaryngologist and a sustained vowel /i/ or /e/ was spoken for 5 seconds. Since the 2D VKG is a rolling shutter method, a sharper image can be obtained at a frequency corresponding to a multiple of the camera frame rate [23]. To this end, voices of multiple frequencies (100, 125, 150, 175, 200, 225, 250 Hz) close to the frame rate of the 2D VKG camera were provided as auditory feedback and induce vocalization with the same sound.
Data analysis
The recorded images were loaded with 2D VKG analysis software to perform quantitative analysis. The tilt of the image that may occur during examination with a laryngoscope can increase the error rate in calculating parameters. To correct this, the 2D VKG image was post-processed so that the straight line between the anterior commissure of the vocal fold and the posterior vocal process was perpendicular to the horizontal center line.
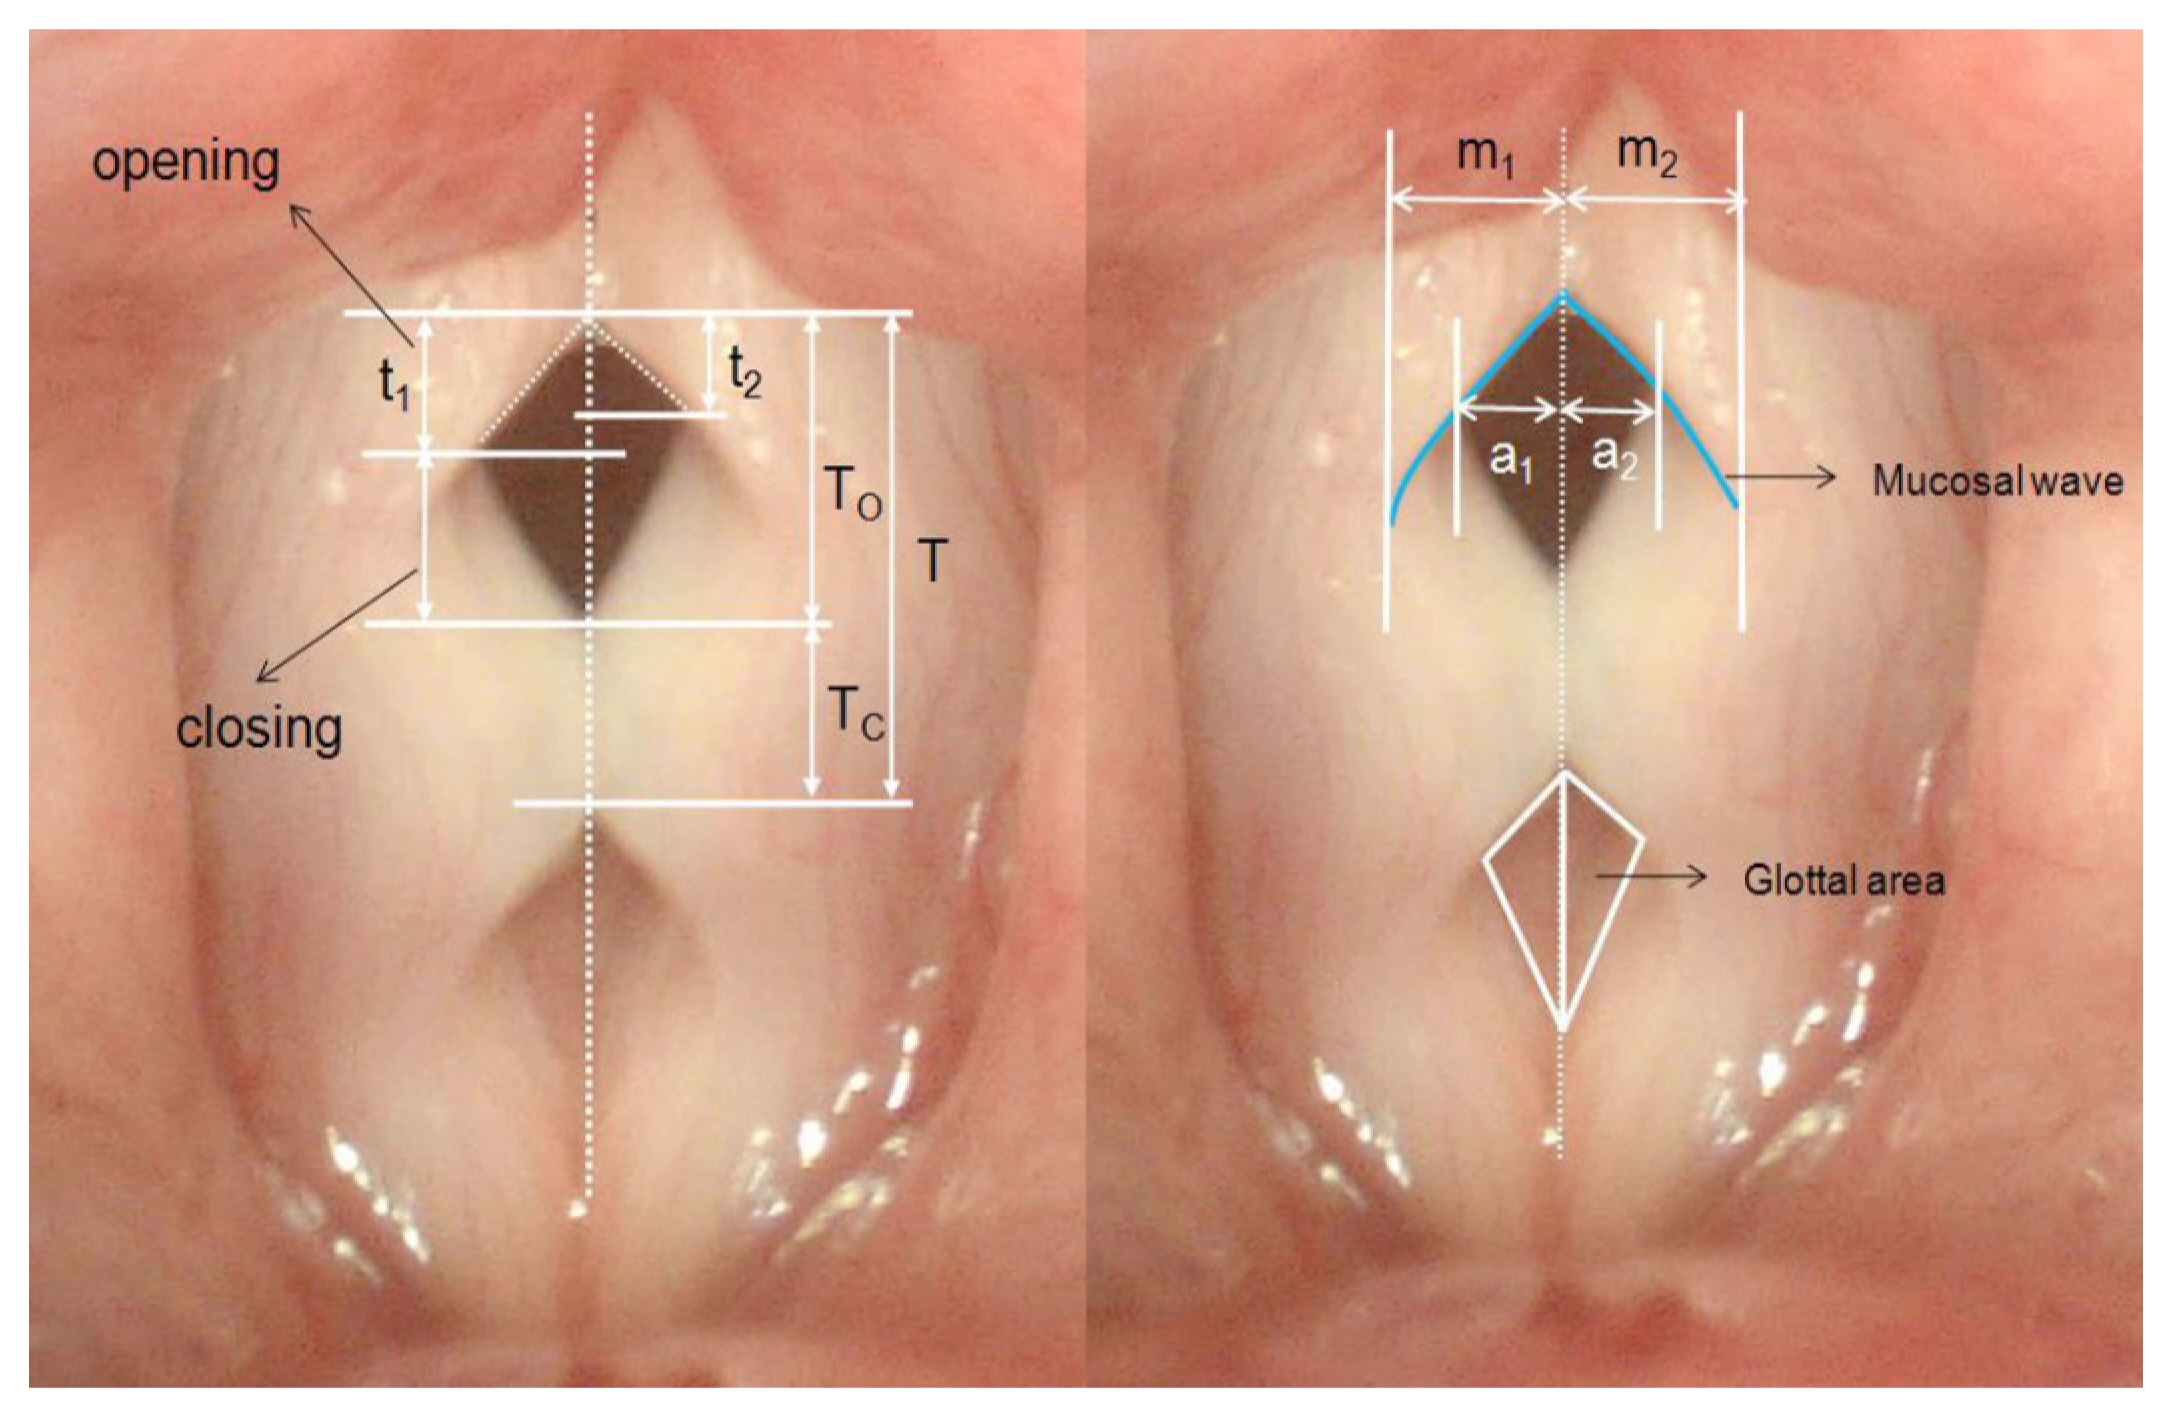
In this study, as shown in Figure 4, threshold segmentation method based automatic quantitative analysis was performed on open quotient (OQ), phase symmetry index (PSI), amplitude symmetry index (ASI), objective parameters of 2D VKG, whose clinical usefulness was verified in previous studies [11,12].
When there is a gross error exceeding ±5 pixels at the glottal edge of the segmented 2D VKG image by digital image processing, an automated quantitative analysis was performed that corrected the edge using a manual plotting technique.
RESULTS
Vibratory characteristic of vocal fold with fibrotic change on 2D VKG
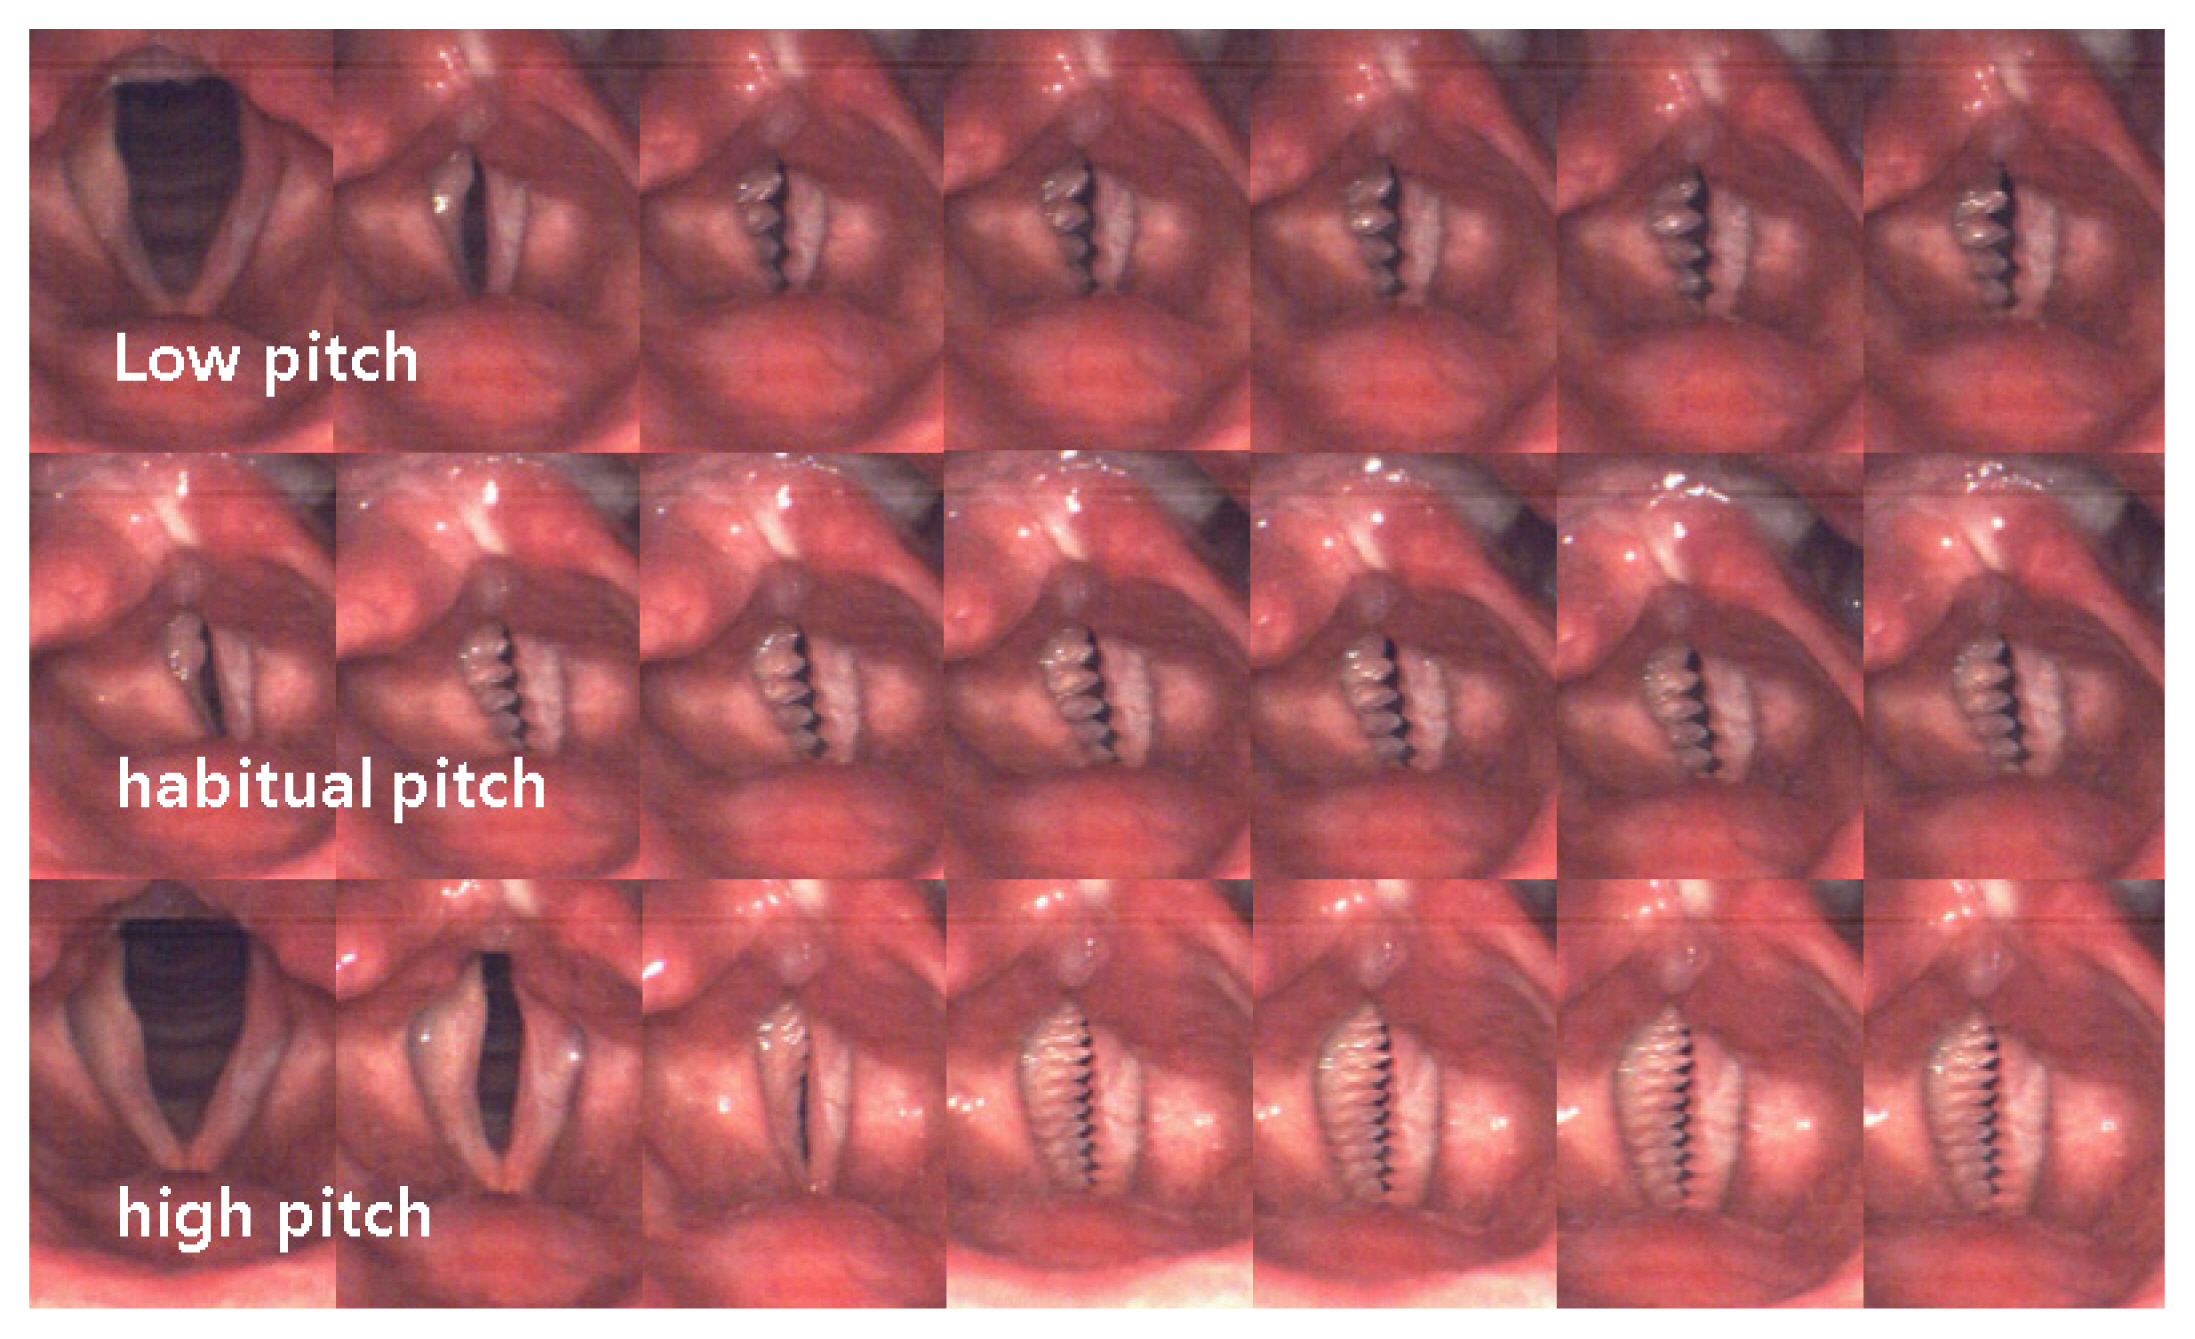
Figure 5 is a sequential image of vocal fold vibration of a patient with fibrotic changes in the superficial lamina propria of left vocal fold after laser microsurgery. It is can be observed that but incomplete glottal closure, amplitude different by decreased amplitude of left vocal fold, and the phase difference of left and right vocal fold. There is a difference in ASI and PSI, but frequency of left and right vocal fold is the same, and it can be seen that the vibrating cycle increases from low to high pitch.
Quantitative analysis on 2D VKG
From 2D VKG images that can acquire kymographic images of the entire vocal fold, the region of interest and glottal edge were extracted using the Otsu’s method and quantitative analysis was performed. Forty samples were analyzed by automatic analysis, and 39 were properly segmented except for one with insufficient light intensity. As a result of visual-perceptual analysis of images, fine errors within ±5 pixels were observed in 30 out of 39, enabling a relatively accurate analysis. Such errors are caused when the edges are unclear due to the influence of nearby pixels when the images overlap. In addition, gross errors exceeding ±5 pixels were observed in 9 out of 39, and these errors appeared in cases where no edge was found in the posterior commissure or segmented based on the mucosa of the anterior commissure.
The quantitative analysis result using automatic analysis and the quantitative analysis result of automated analysis correcting the error of edge extracted from automatic analysis with manual plotting technique were compared with non-inferiority test (Table 1). Automatic analysis and automatic analysis are 0.59 (SD=0.14), 0.64 (SD=12) in OQ, 0.50 (SD=0.08), 0.48 (SD=0.12) in PSI, 0.68 (SD=0.12), 0.72 (SD=0.24) in ASI, respectively, and there was statistically significant difference in OQ and PSI, but not in ASI.
Table 2 shows the results of calculating the 2D VKG images of the two groups by automated analysis. The results of vocally healthy group and the transoral laser microsurgery group are 0.06 (SD=0.02), 0.64 (SD=12) in OQ, 0.10 (SD=0.04), 0.48 (SD= 0.12) in PSI, 0.08 (SD=0.04), 0.72 (SD=0.24) in ASI, respectively, and statistically significant differences were shown in all parameter.
DISCUSSION
In this study, we developed an analysis system capable of quantitative analysis by automatic and automated methods by recognizing 2D VKG videos, and quantitatively analyzed the vocal fold vibration characteristics of patients undergoing transoral laser microsurgery using this system.
Various laryngeal imaging modalities using a laryngoscope have been used in the detection and observation of the prognosis of early glottis cancer. Among them, the laryngeal endoscope is relatively easy to use and can obtain high-quality vocal fold images, so it is used as a key procedure in clinical practice along with a biopsy. However, since it is not suitable for tracking vocal fold vibration, it is difficult to observe epithelial changes or to discriminate benign tumors from malignant tumors [2].
Since LVS can observe not only morphological peculiarities but also functional vocal fold vibrations, quantitative analysis using this is useful for observing changes after treatment such as radiation and phonosurgery. However, since the LVS image is provided as a processed image rather than the actual vocal fold vibration, it is difficult to acquire stroboscopic images in severe dysphonic voice, diplophonia, spasm, voice onset, and vocal function at offset, where periodicity is difficult to detect [24]. HSV and HSV post-processing methods are useful because they can observe actual voice vibration and can make various modifications, but have a disadvantage in that it takes a lot of time to obtain the final result. VKG, which can observe actual vocal fold vibration in real time, has been developed, but has a limitation in extracting only a specific pixel line from the entire laryngeal image [3].
On the other hand, 2D VKG can observe the movement of the entire vocal fold in real time and prevent distortion due to patient movement that occurs in line scanning VKG, and provided both spatial and temporal information in one image at the same time, so intuitive analysis is possible [11,25]. In addition, Since object parameters such as F0, OP, CQ, speed quotient, PSI, ASI, mucosal wave magnitude difference, and glottal area asymmetry index and subjective parameter such as mucosal wave, cycle to cycle variability, absence of vibration, interference of surrounding, lateral peak, medial peak, and cycle aberration can be measured, it can be usefully used for evidence-based intervention [12]. These numerical results can be used not only for normal vocal fold analysis, but also for precise evaluation of vocal fold diseases, and objective comparisons in treatment prognosis comparisons.
In previous studies, quantitative analysis using various objective parameters in 2D VKG images was attempted and was effective in evaluating aperiodic vocal fold vibration [12,23,26]. However, in the existing post-analysis study, it was difficult to evaluate the dynamic vocal fold movement by performing a quantitative analysis on a single still image, and the clinical use was limited due to the analysis using a hand-operated method.
In order to compensate for this, this study programmed to automatically extract the outline of the kymogram image with the threshold segmentation method by importing the entire video only once, rather than the method of importing and analyzing several black and white still images individually. A tracking algorithm was used to obtain an image of a desired area. In addition, a function to modify the point of the manually extracted glottal edge was added, and parameters were automatically calculated based on the extracted area.
A quantitative evaluation of the existing objective parameters is important, but the variation of the periodic period that is judged by the actual movement of the kymography movement, the vibration-free region of the vocal fold, the interference around the vocal fold, the inner and outer boundaries of the vocal fold, the pattern of mucous membrane waves, periodic abnormalities, etc. Since the subjective parameters of are very important, the interface for the subjective evaluation items was constructed so that the inspector could easily input these items, and the output and storage were also possible.
In order to see the validity of the automatic analysis, a more accurate analysis was possible in the automated analysis as a result of comparing the result of the automatic analysis and the result of the automated analysis corrected by the manual plotting technique for the frame where the segmentation error was observed. 97.37% of the images were recognized, but there was a gross error in 21.05% [22]. In the study of Moukalled [22], the success rate of image recognition by kymography was 98%, whereas the post-analysis of the recognized image showed 76% accuracy. However, there was no statistically significant difference in the comparison of quantitative analysis. In the case of viewing an area like GAW, the effect of mucosa, etc., affects the overall result a lot, but the measurement of the parameter using the width at the vertical pixel row level was relatively less affected by the error.
The method of extracting glottal edges using computer vision based analysis method and automatically processing even parameter analysis can improve clinical usability by enabling rapid analysis. However, threshold segmentation methods may not properly separate the pixel intensity of the glottal area due to the difference in brightness when the resolution is low or when upper-low lip of vocal fold appear simultaneously, and the vocal fold mucus is recognized as vocal fold tissue. Can occur [21,22,27].
As a result of examining the vocal fold vibrations of patients who underwent transoral laser microsurgery using the automated analysis method, ASI, PSI, and OQ showed differences from those of the normal group. In the case of patients who underwent transoral laser microsurgery, the mucosal wave decreases because the epithelium of the vocal ligament is dissected (medical findings related to vocal fold vibration). These patients mainly showed incomplete closure of the vocal fold and decreased mucosal wave and within-cycle asymmetries in phase, amplitude, and closure axis compared to the normal group [28,29]. However, in the case of type I or type II, it has been reported that the voice may improve after 6 months and restore the same level of voice as radiation treatment [30].
The evaluation using 2D VKG was effective in evaluating the irregularity of the vocal fold vibration, but due to the characteristics of the rolling shutter camera, more cycle tracking was possible only by exposing vocal fold to the camera as much as possible. In addition, depending on the frame rate of the camera, the vocal fold overlapped in the image, causing an error in the segmentation of the glottal area [31]. In future studies, it is necessary to apply a method to quantify vertical phase differences, and to improve the accuracy of automatic analysis by applying an image processing method that can discriminate mucosa of anterior commissures. In future studies, it is necessary to apply a method to quantify vertical phase differences, and to improve the accuracy of automatic analysis by applying an image processing method that can discriminate mucosa of anterior commissures.
CONCLUSION
Quantitative analysis of 2D VKG images was effective in evaluating the asymmetric vibration pattern of the entire vocal fold tissue. In addition, the threshold segmentation using Otsu’s method properly recognized the glottal area, and the automated analysis with the addition of the manual plotting technique improved the accuracy of the inspection by accurately segmenting the glottal edge. Therefore, 2D VKG will be useful as a laryngeal imaging technique to visualize the structure and function of the vocal fold, and automated analysis is expected to increase the clinical usability of 2D VKG.