Examining the Item-Level Psychometric Properties of the Communicative Effectiveness Survey-Revised for People with Parkinson’s Disease and Dysarthria
Article information
Abstract
Purpose
To examine the psychometric properties of the Communicative Effectiveness Survey-Revised (CESR), a patient reported outcome measure of communicative effectiveness for people with Parkinson’s disease (PD) and dysarthria using Rasch analysis, a one-parameter logistic probability model based on principles of scientific measurement.
Methods
60 individuals with PD and hypokinetic dysarthria rated their communicative effectiveness on a 27-item, 4-point equal interval scale. Exploratory Factor Analysis (EFA) was run to determine unidimensionality. Rasch analysis was completed using the rating scale model. The various analyses allow researchers to examine the item-level psychometric properties of the CESR, which result in measures of validity, reliability and sensitivity.
Results
The EFA demonstrated a single linear construct (confirmed unidimensionality) which allowed Rasch analysis to proceed. Results indicated: the theoretical item difficulty hierarchy established a priori had a strong positive correlation with the CESR item difficulty hierarchy, indicative of construct validity; the 4-unit rating scale comprised equal intervals; the match between person ability and item difficulty was near the ideal range, indicative of content validity; person reliability (comparable to Cronbach’s alpha) was strong; 4) the CESR separated respondents into 4 statistically significant ability levels, indicative of respondent reliability and sensitivity of the measure; and no ceiling or floor effects existed, although participants demonstrated a wide range of ability.
Conclusions
The CESR demonstrated strong item-level psychometric properties which were indicative of validity, reliability and sensitivity of the scale for use with individuals with PD and dysarthria. Further testing must be completed to determine cutoff and clinically meaningful difference scores.
INTRODUCTION
Effective communication is critical for safety, independence, and obtaining the highest quality healthcare [1] as well as quality of life. Unfortunately, aging leads to sensory and cognitive declines (e.g., hearing, vision, and memory) [2] and diseases, such as Parkinson’s disease (PD), which may significantly affect a person’s ability to communicate effectively [3]. Difficulty communicating, whether due to typical aging or disease, often leads to isolation, depression, reduced independence, poorer quality of life, and increased burden on caregivers. Therefore, it is imperative that researchers and clinicians have assessments of communicative effectiveness, defined as a person’s ability to actively and efficiently get his/her message across successfully at home, or in community settings to participate in life roles [4], to identify problems, direct treatment, and determine treatment outcomes in older people with and without neurologic diseases or disorders.
The aged are the most rapidly growing segment of the population throughout the world [5]. As people age, they are more likely to be diagnosed with a neurologic disease, such as PD [6]. Approximately 80% of people with PD eventually demonstrate a motor speech disorder, hypokinetic dysarthria [7], which is distinguished perceptually from other types of dysarthria by “reduced loudness, breathy-tight dysphonia, monopitch and monoloudness, and imprecise and sometimes rapid accelerating or blurred articulation” (p. 127) [8]. As Barnish and colleagues [9] observed however, research and treatment for people with PD and dysarthria has focused on the impairment (i.e. vocal loudness, articulatory precision, rate control), although people with PD self-report that their ability to participate in everyday communicative interactions is more important to them than the speech impairment [10,11]. For example, there is an evidence-based treatment to increase vocal loudness for people with PD and dysarthria that has been widely adopted by speech-language pathologists [12] but its efficacy has not been demonstrated beyond changes in impairments and speech intelligibility. However, almost no research has been done in the area of assessment or treatment of the participation restrictions that result from reduced communicative effectiveness by people with PD and dysarthria as they try to fulfill their social roles in everyday situations [9]. Often the person’s perception of a communicative restriction may be internal rather than observable, which requires a survey or a qualitative study to understand. For that reason, there has been increased interest in patient reported outcome measures in the past two decades.
Patient reported outcome measurement
As clinical trials have proliferated, interest in obtaining the participant’s perception of the outcome when the outcome cannot be measured objectively, has increased as well. Researchers and clinicians have come to realize that important information about a treatment’s effect may be lost if the person receiving the treatment does not provide input [13]. This has led to an increase in the development of Patient Reported Outcome (PRO) measures to obtain the patient’s perspective on how well a compound worked, or how they felt after a treatment. PRO developers refer to constructs that cannot be observed or objectively measured as latent traits [14]. Examples of latent traits include pain, cognition, and in the case of this report, communicative effectiveness. PRO development typically involves developing large item banks that address the measured constructs. They use item response theory (IRT) [15] and computerized adaptive testing (CAT) to develop precise and efficient PROs that can reduce examiner and examinee burden because a respondent will only receive questions calibrated to his/her ability level. Please see the National Institute of Health Patient Reported Outcomes Measurement Information System (PROMIS) website for a complete bibliography on PRO development, IRT methodology and CAT technology (http://www.healthmeasures.net/explore-measurement-systems/promis).
Rasch analysis [16] and other IRT models have been used extensively in PRO development in the past two decade rather than Classical Test Theory (CTT). Because space is limited, it is not possible to provide an in-depth review of IRT development. Please refer to a tutorial geared specifically to the field of Communication Disorders, in which the authors discuss the differences between CTT and IRT, and provide suggestions for optimal interpretation of reports that use Rasch analysis [14]. Additionally, there are a number of texts available for those interested in learning more about Rasch analysis from theory to practice [17,18]. Finally, the Institute of Objective Measurement contains a wealth of information from the mathematicians and measurement experts of Rasch analysis (https://www.rasch.org). What follows is a brief summary of the measurement principles used in this study.
To begin, the Rasch model is based on the same formula as the one-parameter (1-PL) IRT model developed in the 1950s and 1960s to meet the needs of large-scale educational testing [19]. However, the Rasch model proposed by Georg Rasch sought a model that would adhere to the standards of scientific measurement, in other words, objective measurement [16], defined as:
“Objective measurement is the repetition of a unit amount that maintains its size, within an allowable range of error, no matter which instrument, intended to measure the variable of interest, is used and no matter who or what relevant person or thing is measured.” (IOM https://www.rasch.org/define.htm, accessed 1/23/18)
Therefore, objective measurement requires that the instrument measure one trait (e.g. a ruler measures length). The instrument must have equal and additive units of measurement (e.g. the inch or the centimeter is the basic unit of measure on a ruler) that do not change. Finally, the instrument may have various forms, but must be able to measure anything or anyone for the trait of interest (e.g., length may be measured with a ruler, a meter stick, a tape measure). One may ask, how can objective measures be developed in the social sciences when much of the data are based on nominal and ordinal scaling? This is where the Rasch model (and other IRT models) differs from CTT. Most instruments used by speech-language pathologists were developed using CTT, wherein all items on a test must be administered. An individual’s results are typically converted to a percentile or standard score, which is based on normed or criterion-referenced samples. Scores on two tests of a given construct, such as auditory comprehension, cannot be directly compared because of that. For example, a person may receive the same score pre- and post-treatment, but have answered different questions incorrectly each time. Therefore, many test developers use the Rasch model because of the measurement benefits (see IOM definition above) it provides.
Rasch analysis benefits PRO developers because it provides measurement precision by calibrating a number for each item, rather than calibrating a score for a test or subtest in CTT. Zero logit represents the probability of a person of average ability answering a given question 50% of the time. Thus, easier items have a lower number and harder items have a higher number. More precisely, the Rasch model is defined as “a mathematical model based upon a latent trait, which accomplishes probabilistic conjoint additivity (conjoint means measurement of persons and items on the same scale and additivity is the equal-interval property of the scale )” (p. 1122) [20]. Rasch uses a probabilistic model that transforms ordinal data into interval data, which may then be used in parametric statistical analyses. The result is item difficulty and person ability calibrated along a single interval scale (i.e. from least able to ablest persons and from easiest item to hardest item) of the latent trait, in this study, communicative effectiveness. Intervality allows for parametric statistical analysis and the ability to compare scores, such as pre-post treatment scores to determine improvement. Not only can a single person be measured at different points in time, but multiple people can be measured at one point in time and their scores compared. Rasch analysis provides information comparable to validity, reliability and sensitivity, but uses different terminology which will be described in the next section.
With these benefits in mind, the investigator chose Rasch analysis to analyze the item-level psychometric properties of the original Communicative Effectiveness Scale (CES) [21] and now the Communicative Effectiveness Scale-Revised (CESR) which will be discussed in the next section.
Communicative effectiveness survey
As stated earlier, the investigator operationally defined communicative effectiveness as a person’s ability to actively and efficiently get his/her message across successfully at home, or in community settings to participate in life roles [4]. Using this definition, the CES was intended to be a treatment outcome measure in the participation domain of the World Health Organization International Classification of Functioning Disability and Health (ICF) (World Health Organization [WHO], 2001). The ICF defines participation as involvement in life situations. If a person is unsuccessful in those life situations he/she is said to have a participation restriction. In the case of people with PD, their involvement in many life situations may be restricted by not only their physical deficits, but also by their reduced communicative effectiveness. The CES [11,21], an 8-item survey was the first PRO designed to assess communicative participation restrictions in people with Parkinson’s disease and dysarthria. Currently the only other communicative participation-based PRO is the Communication Participation Item Bank (CPIB) [22,23] which includes a disorder-generic measure, but was not specifically designed for people with PD.
After the original CES data were collected we interviewed participants to get their opinions about the survey. During those discussions participants suggested some situations in which their communicative effectiveness became less effective regardless of their speech. The situations they described had to do with both environmental and personal factors, not their dysarthria. For example, one client discussed decreased communicative effectiveness when he was fatigued or when a conversation partner was hard of hearing. Others described less effective communication when visiting with a person who had an accent or making small talk with a new acquaintance because they were ill at ease in those situations [11]. Therefore, the investigator determined that the CES should be revised and more items added. While some would suggest that the findings described invalidate the CES [24], one of the benefits of Rasch analysis is that it allows for further refinement of a measurement instrument until the developer is satisfied with the measurement properties of the instrument [25].
In a three-phase study, the investigator used PRO guidelines to expand the CES [13,26,27]. In Phase I older people with PD and healthy controls were interviewed in a qualitative study to gain their perspective on communicative effectiveness (manuscript in submission). In Phase II a team of rehabilitation experts and people with PD and dysarthria used the input from the qualitative study to develop items additional CES items. Input from focus groups of people with PD was used to refine the items before finalizing the 27-item CESR for paper-pencil testing. This report presents the findings from the Phase III study.
Purpose
Use Rasch Analysis to investigate the item-level psychometric properties of the CESR, a 30-item patient-reported outcome measure for people with PD and dysarthria. To achieve the purpose, the investigator asked the following experimental questions:
Do the CESR data represent a unidimensional construct?
Does the CESR demonstrate sound item-level psychometric properties that demonstrate communicative effectiveness can be measured on a linear scale?
Is there a strong positive relationship between the actual item hierarchy of the CESR and the theoretical item hierarchy proposed a priori?
Does the CESR demonstrate adequate range of person ability and item difficulty to separate respondents into >2 levels of ability?
METHODS
Design
This was a prospective study to investigate the item-level psychometric properties of the CESR. All participants received University-approved Informed Consent prior to participating in any screening or data collection procedures. Based on the literature, the investigator aimed to recruit 100 people with PD for the study. Mathematicians and survey developers have ongoing debates on the adequate sample size for IRT and Rasch analysis. Proponents of IRT, which may use more complex models and several parameters rather than a single parameter advocate for very large sample sizes. However, for a 1-PL Rasch analysis, authors have suggested that a sample size of 30 was sufficient to obtain item calibration stability on a polytomous scale within ±1 logit with 99% confidence [28]. Therefore, our final sample size of 60 respondents with PD and dysarthria was sufficient.
Participants
Sixty-seven people with Parkinson’s disease and dysarthria, between 65–89 years of age volunteered to participate in the study. They were recruited from Parkinson’s disease support groups, IRB-approved flyers posted in churches and senior centers, and word of mouth. Seven individuals failed at least one of the following exclusion criteria: presence of dementia, apathy or depression, Hoehn and Yahr ratings of 5 (requiring 24-hour care), Dysarthria Severity Rating of 5 (nonverbal). PD severity based on the Hoehn & Yahr ranged from 1–4 (M=1.87 SEM=0.89) and dysarthria severity ranged from 1–4 (M=2.08, SEM=0.65). See Table 1 for the participant characteristics.

Participant characteristics (N=60)
Procedures
Participants could choose to take part in the experiment at home or in the investigator’s lab. 57 of 60 chose to participate at home. They received a $10 stipend for their time regardless of where the data were collected. Appointments were scheduled so the experiment could begin approximately 60 minutes after PD medication was taken.
The CESR consisted of 27 items with a 4-unit rating scale (1=not at all effective to 4=very effective). The survey was typed in 14-point font on white paper to make it easier for older people to read. Prior to data collection, the questions on the CESR were randomized into 5 different sets of 27 questions to control for fatigue effects. Participants were seated in a quiet room at a table or desk The investigator read the instructions aloud and then people were asked to complete the survey on their own. If they did not understand a question or needed help with writing, the investigator assisted. Research assistants entered item responses in the database using a double entry system to ensure accuracy. The investigator prepared the Rasch analysis control files and performed all analyses.
Rasch analysis
SPSS (v. 22) computer software was used to obtain descriptive statistics. Mplus (v. 6) [29] was used to compute an exploratory factor analysis to determine unidimensionality and examine local dependence. Item-level psychometrics were obtained using WINSTEPS (v.3.7) [30]. The Rasch rating scale model was used. This is the formula:
where:
Pnij is the probability that person n encountering item i is observed in category j,
Bn is the “ability” measure of person n,
Di is the “difficulty” measure of item i,
Fj is the “calibration” measure of category j relative to category j-1, (WINSTEPS software documentation; Introduction, Rasch analysis and WINSTEPS) [30].
The analyses provide the following reports to assist the developer in assessing the item-level psychometric properties of an instrument, both at the item level and the person level:
Item fit statistics
Item fit statistics provide information about the amount of variation between the model and the actual data. It can be thought of as the “noise” in the instrument. An item fit statistic of 1.0 would indicate that the actual responses matched the modeled response probability perfectly. The closer to 1.0 the item fit statistic is, the better. For more classically trained statisticians the item fit statistics are chi-squares based on standardized item/person residuals [31]. There is an acceptable range of item fit criteria in Rasch analysis [32]. For this study acceptable item fit criteria were set at<.06 and ≥1.4 mean square (MNSQ) and >2.0 standardize Z-score (Zstd). Misfitting items were removed until all items met acceptable item fit criteria.
Item difficulty hierarchy
The Wright Map [18] provides a visual illustration of the Rasch analysis, including item hierarchy, person ability calibrated on a single interval scale in logits. “One logit is the distance along the line of the variable that increases the odds of observing the event specified in the measurement model by a factor of 2.718.., the value of “e”, the base of “natural” or Napierian logarithms used for the calculation of “log−” odds (p. 54)” [33]. The map also illustrates the range of item difficulty. An acceptable range of items is between −2 to +2 logits span [17]. Ceiling and floor effects are represented as the items at the extreme top and bottom of the map. Acceptable ceiling and floor effects were set at <10% of the sample [17].
Item mean-person mean
Comparison between the item difficulty mean and the person ability mean is an indicator of how well the items have captured the person ability. The closer the means are to 0 logits the better. A perfect match where both means=0. An acceptable item mean-person mean match is 0±1 logit [17]. A mismatch between item mean and person mean indicates that the items are either too easy or too difficult for the respondents depending on the direction of the mismatch.
Person reliability
Person reliability is comparable to Cronbach’s alpha [34], which is a measure of internal consistency of the measure. What it tells the investigator is the level of expectation one could expect person ability to be replicated if the respondents were given a parallel set of items for the same construct [17]. Acceptable person reliability was set at 0.80 or above.
Person separation
Person separation index is a measure of the number of statistically distinct ability levels the measure separates the people into. A person separation index >2 (standard error units) is needed to attain a 0.8 reliability coefficient [17].
RESULTS
EQ 1. Do the CESR data represent a unidimensional construct?
MPlus statistical software (v. 6) [29] was used to complete the exploratory factor analysis (EFA). Results indicated a one-factor solution based on EFA Fit Statistics. Therefore, Rasch analysis could proceed. See Table 2.

Exploratory factor analysis 1-Factor model fit statistics for the CESR
EQ2. Does the CESR demonstrate sound item-level psychometric properties that demonstrate communicative effectiveness can be measured on a linear scale?
Item fit
Rasch analysis results indicated the following: Three items did not meet the established fit criteria (MNSQ<0.60 ≥1.4, ZStd ≤2.0). They were eliminated from the survey. The remaining analyses were computed on the CESR 27 items. See Table 3 for the final item measures, standard error, and item fit statistics.

Rasch analysis of CESR summary of item measures
Item mean-person mean
Item mean (0 logits) and person mean (0.41) were within 1 logit, indicating a nearly perfect match between item difficulty and person ability. No ceiling and floor effects were noted. The measure range was 5.57 logits, ranging from −2.35 to +3.22 logits). Figure 1 illustrates these results. Table 4 provides a comparison of the actual model results compared to the ideal model for all of the indices reported here.
The Communicative Effectiveness Survey Revised (CESR) Wright Map illustrates many of the psychometric properties reported. It illustrates person ability and item hierarchy calibrated along a single interval scale (expressed in logits), the match between person ability and item difficulty means, the wide range of scores which separates the survey into four levels of severity, and no ceiling or floor effects. The key directs readers to the salient points on the map.
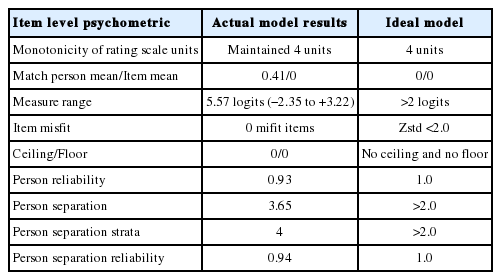
Actual model analysis of item level psychometric properties of the CESR, compared to the ideal model
EQ3. Is there a strong positive relationship between the actual item hierarchy of the CESR and the theoretical item hierarchy proposed a priori, indicative of construct validity?
A theoretical item hierarchy established a priori by three members of the research team was compared to the actual item hierarchy. Results indicated a statistically significant, strong, positive correlation between the two (rs=0.94, df=25, p<0.01).
EQ4. Does the CESR demonstrate adequate range of person ability and item difficulty to separate respondents into >2 levels of ability?
Person reliability
Person reliability (comparable to Cronbach’s alpha) was high (0.93).
Person separation
Person separation index of 3.68 indicated 4 statistically different ability groups.
DISCUSSION
Worldwide, the aged comprise a larger and faster growing segment of the population than any other group. As people age they are at higher risk for neurodegenerative diseases such as PD. This means an increase in the number of older people who will need healthcare and rehabilitation to remain independent and fulfill their various life roles by being mobile or communicating effectively. Researchers have established that people with reduced communicative effectiveness may receive less adequate healthcare which can lead to a cascade of difficulty including depression, isolation, loss of independence, and reduced quality of life. This is particularly relevant for individuals with PD who will experience both physical and communication deficits. It is even more relevant considering the literature that has reported people with PD and dysarthria may be more concerned with aspects of communicative effectiveness and cognition than they are with their speech impairment per se [9,10]. CESR development was designed to provide researchers and clinicians with an outcome measure specifically designed for people with PD and dysarthria which could address some of those issues.
The CESR demonstrated strong item-level psychometric properties, which result in the first known objective measure of communicative effectiveness designed specifically for people with PD and dysarthria in the ICF participation domain. The CESR asked respondents to rate their communicative effectiveness in 27 communicative situations they might find themselves participating in, from the easiest item—having a quiet conversation at home, to the most difficult—having a conversation in a noisy environment outside. Until now very little research has been done to assess or treat communicative participation in people with PD and dysarthria specifically, although there are numerous studies that report successful treatment of the speech impairments related to hypokinetic dysarthria, such as increasing loudness or precision of articulation [12,35]. However, as authors have pointed out with regard to treatment outcomes, improvement in one domain (e.g. impairment) do not necessarily mean there will be improvement in another domain (e.g. activity or participation) [9]. As researchers and clinicians in the field of Communication Disorders it is important to provide assessment and treatment across the ICF domains of impairment, activity, and participation to improve our clients’ communicative effectiveness and thus their quality of life. This task may be difficult to achieve when no valid or reliable assessments exist in a domain, such as in the participation domain for motor speech disorders.
As discussed, Rasch analysis is useful to instrument developers because it is based on principles of objective measurement, unlike tests developed using CTT. Objective measurement requires that the instrument measure one trait (e.g. a ruler measures length). In this case, results indicated that communicative effectiveness was a single latent trait. Next, according to the definition, an instrument must have equal, additive, and invariant units of measurement (e.g. the inch or the centimeter is the basic unit of measure on a ruler, the logit is the basic unit of measure on a Rasch scale). In this case, the range of item difficulty measures and person ability measures were well matched but ranged across many logits, which demonstrated the CESR had captured a wide range of ability levels in only 27 questions.
There are two main benefits of interval scaling. First, it allows researchers to perform parametric statistical inference testing, which typically cannot be done with ordinal or nominal data, although it often is done in CTT. Second, and perhaps more importantly, interval scaling provides clinicians with numbers that carry meaning. For example, if a person improves from a pre-treatment score of 5 to a post-treatment score of 10, a clinician can say, with confidence, that the person has improved two-fold because interval scales have units of measurement that are additive as well as invariant. Another benefit of Rasch analysis, that makes reporting scores or progress more meaningful is the Wright Map which provides a visual illustration of the items arranged by difficulty. A client’s scores can be placed on the map to illustrate where he began treatment, where he ended treatment, and the items above the stopping point will illustrate what more needs to be done to improve communicative effectiveness. This is quite different from simply reporting something like improvement from 20% to 40%. Those numbers do not carry much meaning because percentages are not units of measurement. Nor do percentage scores provide an index of where the person functions with regard to the items he/she can perform. For example, it is possible for the same person to score 20% correct during two test sessions, but miss different items each time.
CONCLUSION
As the number of people with PD and dysarthria increase, there will be increased need to provide them with assessments and treatments that address their impairments, activity limitations, and participation restrictions. We are not prepared to meet those needs at this time. However, the work has begun. The results of this analysis show that the CESR demonstrated strong item-level psychometric properties that represent the measure’s validity, reliability, and sensitivity to a wide range of ability. Although further validation of the CESR will be completed in the future, the CESR fills a void now for researchers and clinicians who need to assess communicative participation in individuals with PD and dysarthria, based on the strength of the results presented.
ACKNOWLEDGEMENTS
This project was funded by the Louisiana State Board of Regents Research Competitiveness Grant LESQSF#208-11-RD-A-07. The author received three months of salary support through funding from 2008-2011. The author has no conflicts of interest to report. Furthermore, the author intends to make the Communicative Effectiveness Survey Revised available at no charge to anyone who would like to use it as a treatment outcome measure for people with Parkinson’s disease and dysarthria. Many thanks go to members of the Parkinson’s disease Support Groups of Baton Rouge, New Orleans, Covington, and Metairie, Louisiana for the time and effort they gave to participate in this project.